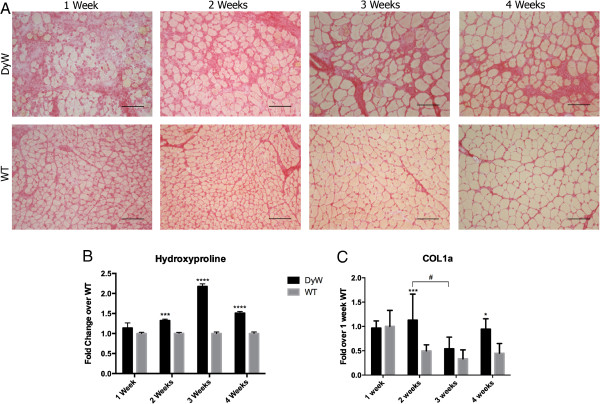
Figure 6.

Picro-Sirius Red staining, hydroxyproline assay and quantitative RT-PCR show moderately elevated levels of collagen in DyW muscle. (A) Qualitative analysis of Picro-Sirius Red staining done on frozen muscle sections from Lama2DyW (DyW) and wild-type (WT) animals during the first 4 weeks after birth shows increased presence of collagen by weeks 3 and 4. (B) Hydroxyproline assay shows significantly elevated levels of collagen at weeks 2, 3 and 4 (P = 0.0001 at week 2, P < 0.0001 at weeks 3 and 4, all by two-way analysis of variance (ANOVA) (n = 3)). (C) Quantitative RT-PCR shows similar Col1a (collagen, type I, α1) transcript levels between the two groups at weeks 1 and 3, with DyW mice having significantly increased expression at weeks 2 and 4 (P < 0.05 for week 4 and P < 0.001 for week 2, both by two-way ANOVA (n = 5 for all groups). It should be noted that collagen gene expression was extremely variable in both the DyW and WT animals at all time points. Asterisks indicate statistical significance between age-matched DyW and WT animals, hash tags indicate significant changes within the DyW group and Deltas indicate significant changes within the WT group. *P < 0.05, **P < 0.01, ***P < 0.001 and ****P < 0.0001. These statistical representations also apply other symbols (Δ, #). Bar = 100 μm.
