
Figure 4.
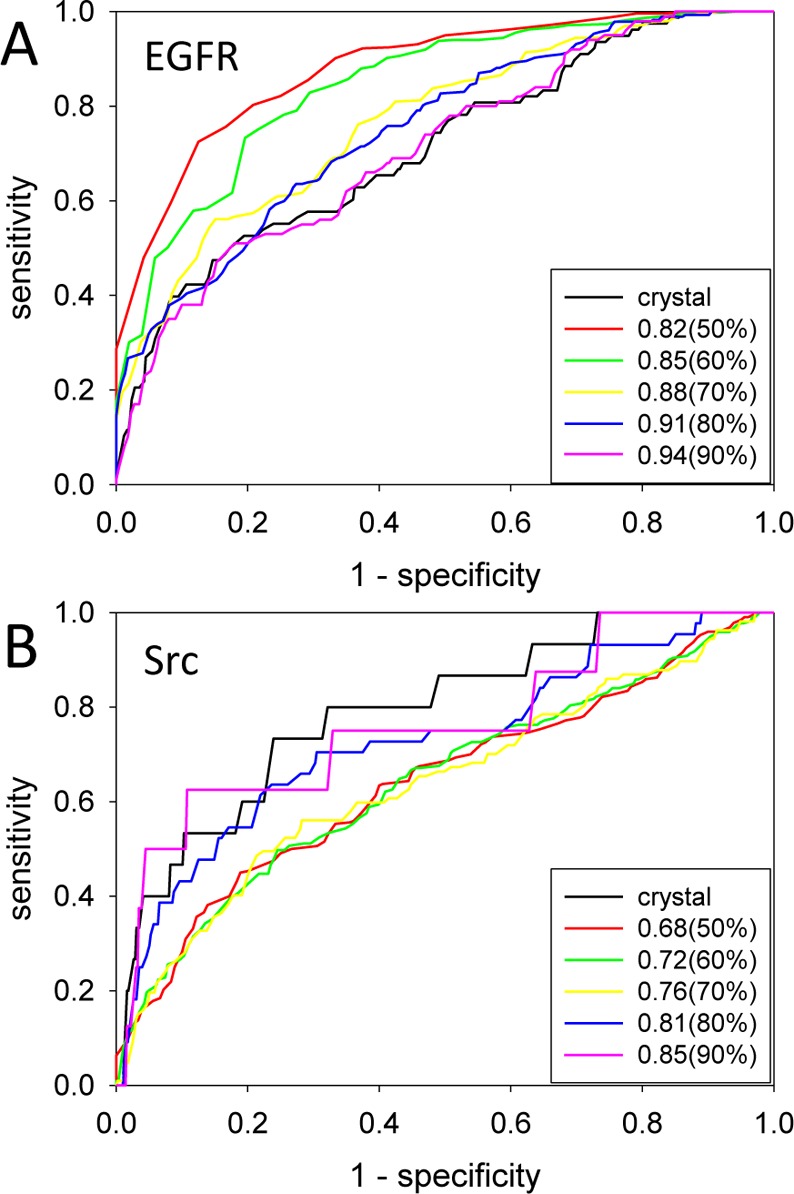
Filtering MD snapshots for a priori identification of high enrichment structures. ROC curves for (A) EGFR and (B) Src protein kinases. Black, red, green, yellow, blue, and magenta curves cutoffs that correspond to crystal structure, 50, 60, 70, 80, and 90% of ROC-AUC range defined as ROC-AUCMAX – ROC-AUCMIN. The number in the legend is the ROC-AUC for each threshold.