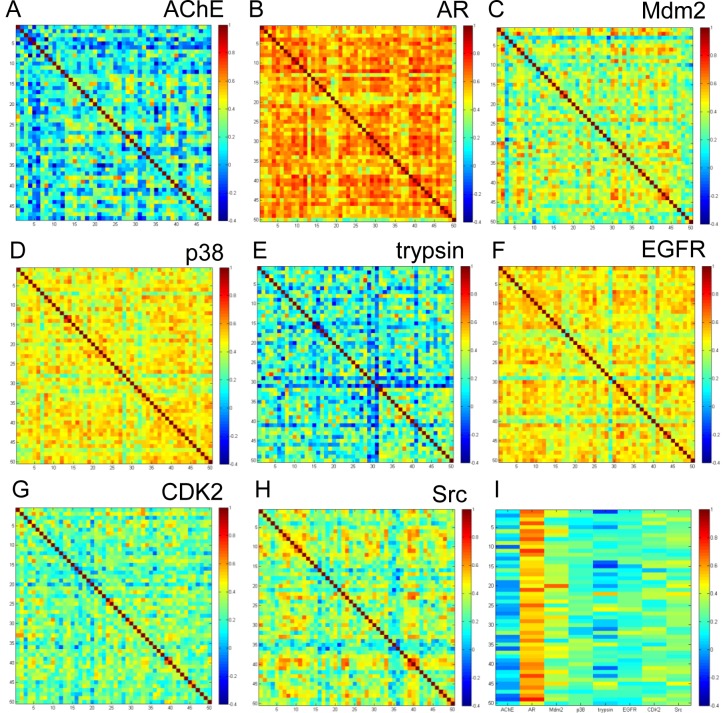
Figure 5.
Correlation in the rank-ordering of compounds between different structures using Kendall’s τ for (A) AchE; (B) AR; (C) MDM2; (D) p38; (E) trypsin; (F) EGFR; (G) CDK2; (H) Src; and (I) correlation between crystal structure (x-axis) and 50 MD clustered MD snapshots (y-axis). From left to right: AchE, AR, MDM2, p38, trypsin, EGFR, CDK2, and Src. Color coding varies from τ = −0.4 (blue) and τ = 1.0 (red).

