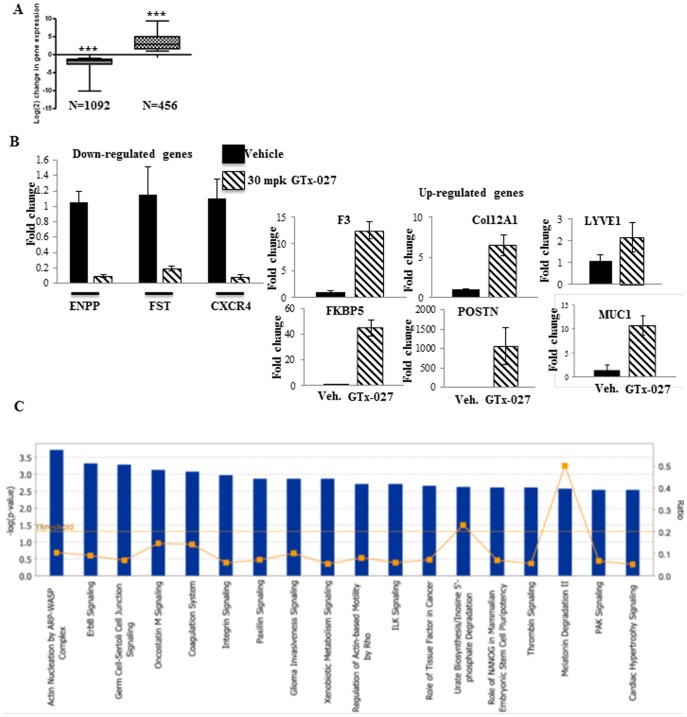
Figure 3. AR Agonist Negatively Regulate Cancer Genes in MDA-MB-231-AR Xenograft.
A. Microarray analyses. RNA from tumors in panel A was isolated, pooled (n = 8/group) and subjected to microarray analysis (Affymetrix Human Gene ST2.0 array). Number of genes up- or down- regulated by GTx-027 is represented as box plot. B. Validation of microarray results using realtime PCR. Gene expression assays to validate the microarray results were performed in RNA from individual tumor samples (n = 8) using realtime PCR primers and probes. Expression of various genes was normalized to GAPDH. C. Ingenuity canonical pathway analysis. The genes that were differentially regulated by GTx-027 were analyzed using Ingenuity pathway analysis software (IPA3). The canonical pathways that are over-represented in GTx-027 treated tumors are given as bar graphs.

