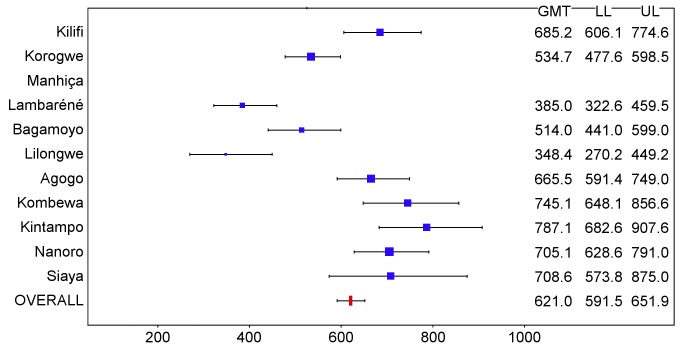
Figure 16. Anti-CS antibody geometric mean titers (EU/ml) in RTS,S/AS01 recipients 1 mo after dose 3 in children 5–17 mo of age at enrollment, ordered by increasing malaria incidence at each study site (per-protocol population).
The blue squares reflect the number of participants in the per-protocol population with a valid assay result available 1 mo after dose 3 in each study site. The horizontal bars show the lower limit (LL) and upper limit (UL) of the 95% confidence interval. Study sites are ordered from lowest (Kilifi) to highest (Siaya) incidence of clinical malaria, defined as a measured or reported fever within previous 24 h and parasite density >0 parasites/mm3 (i.e., clinical malaria secondary case definition), measured in control infants 6–12 wk of age at enrollment during 12 mo of follow-up.

