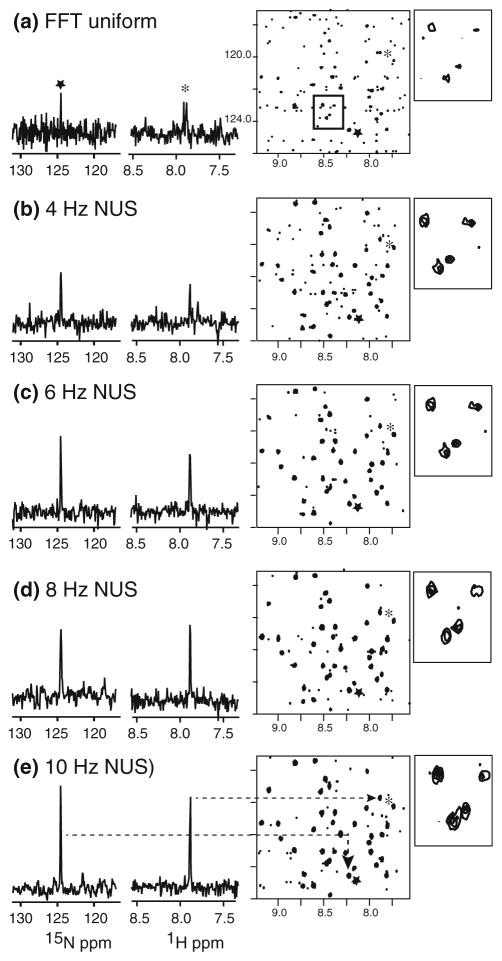
Fig. 3.
Representative one- and two-dimensional views of 1H,15N-HSQC spectra of a 6 mM human ubiquitin sample (Aldrich, Inc.) obtained by uniform sampling and exponential NUS. All NUS spectra are processed by maximum entropy reconstruction in the Rowland NMR Toolkit. http://rnmrtk.uchc.edu) (Hoch and Stern 1996) Each experiment consumed 1.5 Hr total time. Uniform acquisition employed 384 increments with 4 transients per increment, while NUS employed 96 exponentially distributed samples according to the indicated decays (expressed as line widths, see text) with 16 transients per increment

