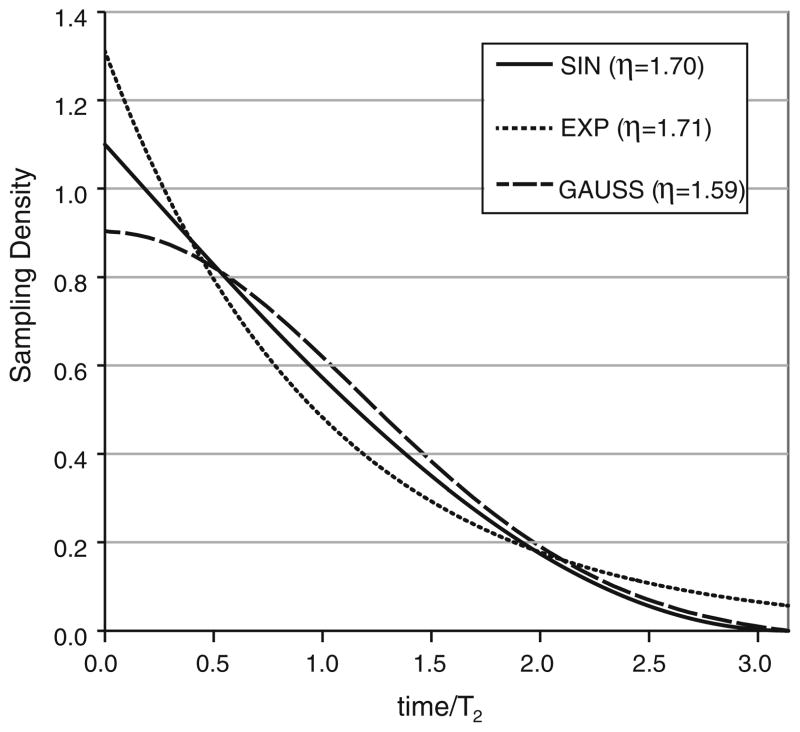
Fig. 5.
Comparison of sampling densities normalized such that the areas under the densities are equivalent, which means they each correspond to the same number of samples. Gaussian and exponential densities are adjusted to correspond to frequency domain line widths of πT2. The sinusoidal density refers to the π–3π/2 segment of a sine function (i.e. the inverted 0–π/2 segment of sine)

