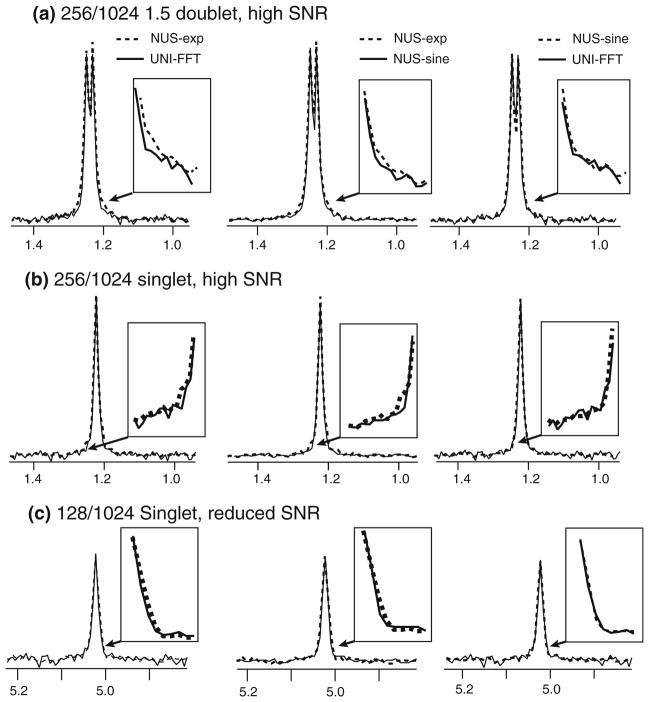
Fig. 6.
Peak broadening near the baseline is examined for synthetic signals injected into real spectrometer noise for sinusoidal and exponential NUS and for uniform sampling. Exponential NUS results in broadening of the beak base relative to uniform sampling. Sinusoidal NUS is always seen to give a narrower peak shape that agrees closely with the peaks produced from uniform data. (NUS spectra obtained by MaxEnt reconstruction and uniform spectra by FFT). Row (a) represents retaining 25 % of samples for the NUS spectra (256 out of a uniform grid of 1,024) and employed a doublet separated by just 1.5 times the line widths of the peaks. Row (b) examines a singlet also retaining 25 % of samples. Row (c) examines a singlet with lower SNR and retaining just 12.5 % of samples (128 out of a uniform grid of 1,024)

