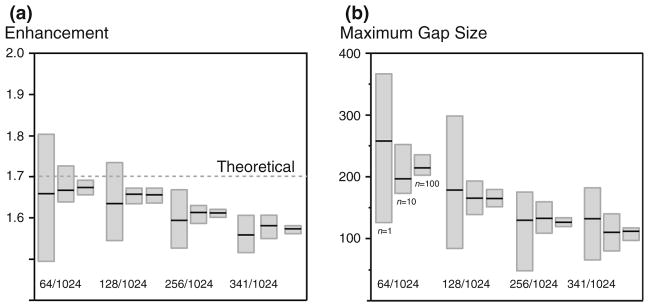
Fig. 8.

Randomly generated sinusoidal NUS sampling schedules were analyzed for their enhancement and gap characteristics as a function of averaging together 1, 10 or 100 schedules. The retention of samples is indicated on the figures and was based on a uniform grid of 1,024 samples. Each box summarizes results from analyzing 15 schedules: extrema are the minimum and maximum values, and the median is the solid black line. See text for discussion
