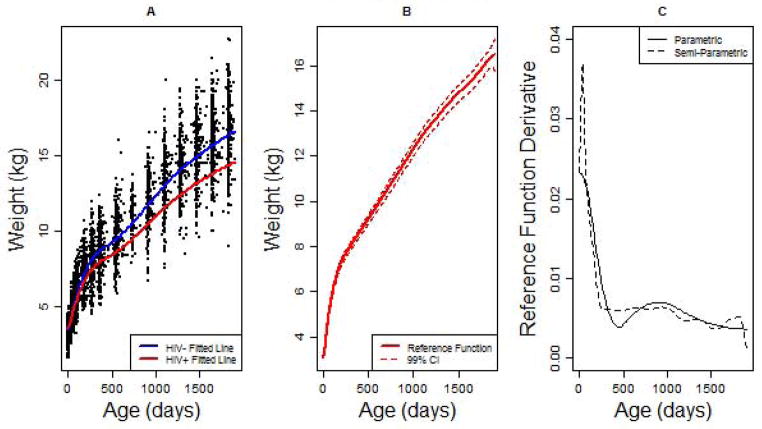
Figure 2.
Plots of the estimated reference time functions for the parametric and non-parametric models presented in Table 2. Plot A depicts a scatter plot of weight by age among infants exposed to HIV. The red line and blue line represent the fitted line for HIV negative and positive infants respectively based on the parametric LRR model. In Plot B, the reference time function as estimated by the penalized spline equation in the semi-parametric model is plotted with a 99% confidence interval. Plot C illustrates the estimated first derivatives of the reference time structure for the two models based on numeric derivation.

