
Figure 3.
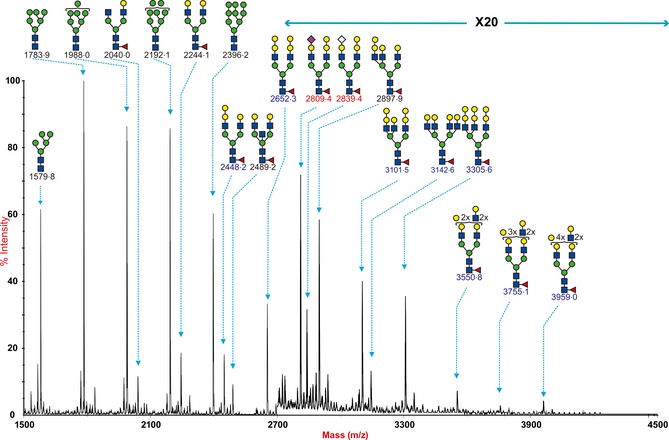
N‐glycan profile of swine trachea. MALDI‐TOF mass spectra of permethylated N‐glycans from the trachea of swine was obtained from the 50% MeCN fraction from a C18 Sep‐Pak column (“Materials and Methods”). Annotated structures are according to the Consortium for Functional Glycomics guidelines. All molecular ions are [M+Na]+. Putative structures are based on composition, tandem MS, and the biosynthetic knowledge. Structures that show sugars outside a bracket have not been unequivocally defined.