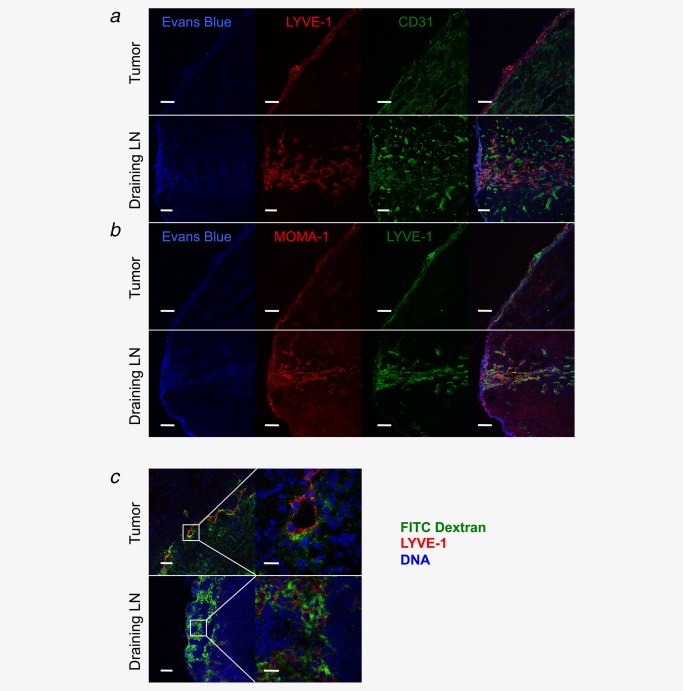
Figure 4.

Afferent lymphatic vessel function detected in MCA‐induced tumors. Evans Blue was injected into the base of the leg and approximately 60 min later the tumor and draining lymph nodes were removed. Frozen sections were prepared and examined for Evans Blue autofluorescence and also stained for LYVE‐1 and CD31 (a) and MOMA‐1 and LYVE‐1 (b). FITC–dextran (5,000 kDa) was injected into the base of the leg and approximately 60 min later the tumor and draining lymph nodes were removed. Frozen sections were prepared and stained for LYVE‐1 and were also counter stained with TOTO‐3 to detect DNA. Low‐power images are shown on the left and high‐power images of the area in the white box are shown on the right (c). Scale bars a, b, and c left: 100 µm. Scale bars c right: 20 µm.
