
Figure 4.
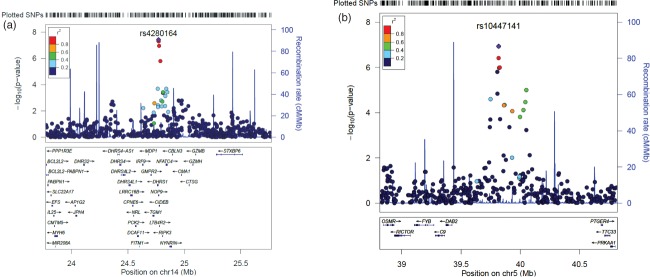
Regional association plots for top associations. (a) SNPs around the association peak on 14q12. (b) SNPs around the association peak on 5p13.
Official websites use .gov
A
.gov website belongs to an official
government organization in the United States.
Secure .gov websites use HTTPS
A lock (
) or https:// means you've safely
connected to the .gov website. Share sensitive
information only on official, secure websites.
Regional association plots for top associations. (a) SNPs around the association peak on 14q12. (b) SNPs around the association peak on 5p13.