
Figure 2.
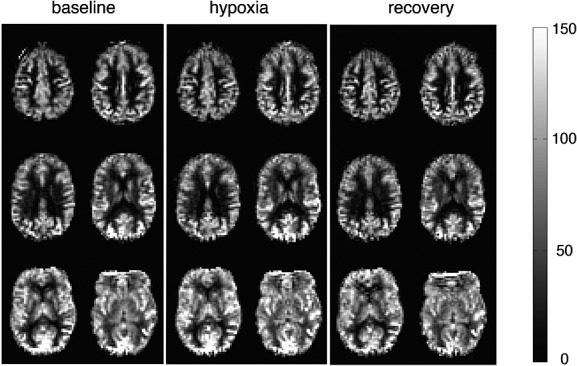
Sample cerebral blood flow (CBF) maps from one individual during normoxic baseline (a), hypoxic hypoxia (b) and normoxic recovery (c). Each map is derived from 5 min of data and has been registered to MNI space. CBF is displayed in mL/100 g tissue/min.