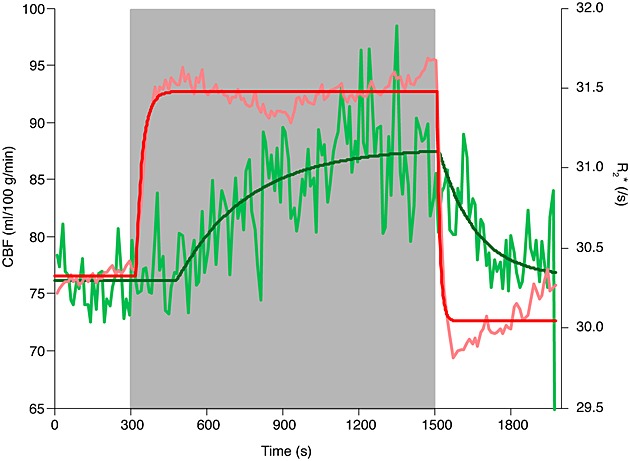
Figure 4.

Cerebral blood flow (CBF) and R2* across whole-brain grey matter. Quantified CBF and the CBF modelled response are shown in light green and dark green, respectively. R2* over time and the modelled response are shown in pink and red, respectively. The time-series data for CBF and R2* were averaged into 11-s time bins for display purposes.
