
Figure 1.
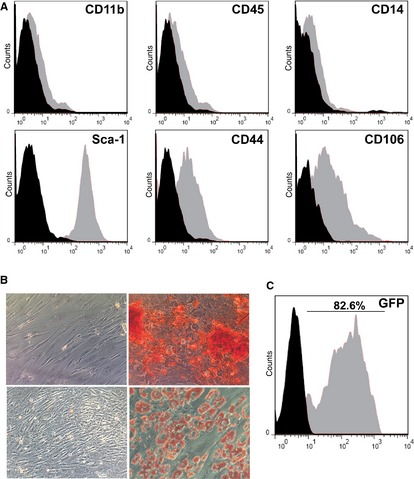
Phenotyping and retroviral gene transduction of mesenchymal stem cells (MSCs). (A) Cell surface marker determination by flow cytometry. X‐axes represent fluorescence intensity, and black histograms are from isotype‐matched controls. Following harvesting and culture in MSC selective medium, the adherent cell population showed a Sca‐1+CD44+CD106+CD11b−CD45−CD14− cell surface marker phenotype. (B) The cells produced calcified extracellular matrix upon culture in osteogenic differentiation medium as demonstrated by alizarin‐red staining (upper‐right image) or fat deposits upon culture in adipogenic differentiation medium as shown by oil‐red O staining (lower‐right image). Upper‐left and lower‐left micrographs show the respective stainings on cells cultured in control media. (C) The MSCs were efficiently transduced to express green fluorescent protein employing a murine stem cell virus retroviral vector. Data are representative of three independent experiments.