
Figure 6.
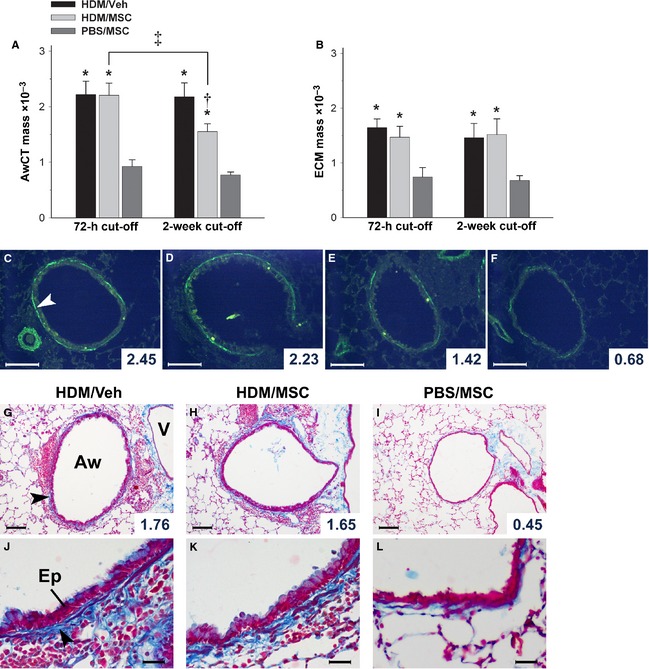
Effect of mesenchymal stem cells (MSCs) on airway structure. (A, C–F) AwCT was identified by α‐smooth muscle actin (α‐SMA) immunofluorescent detection. The tissue autofluorescence background allows for histological recognition to identify the α‐SMA signal that corresponds to AwCT. The selected AwCT signal was digitally extracted and normalized by airway size as AwCT mass. The images correspond to a house dust mite (HDM)/Veh animal at 72‐h cutoff (C), HDM/MSC animals at 72‐h (D) and 2‐week (E) cutoffs, and a phosphate‐buffered saline (PBS)/MSC animal at 72‐h cutoff (F). (B, G–L) Masson's trichrome staining was employed to evaluate overall extracellular matrix (ECM). The blue color component corresponding to the airway wall was selected, extracted, and normalized by airway size as ECM mass. Images in (G–L) correspond to the experimental groups as indicated, on the 2‐week cutoff. All micrographs show examples of airways with AwCT or ECM mass values close to the mean of the corresponding group (individual airway values shown). Aw, airway. V, vessel. Ep, airway epithelium. White arrow head in (C) signals AwCT. Black arrow heads in (G, J) signal ECM. *: P < 0.05 vs PBS/MSC; †: P < 0.05 vs HDM/Veh and PBS/MSC; ‡: P < 0.05 for intermodel comparison as indicated. Group legend applies to both A and B. Scale bars: 100 μm in C–I; 25 μm in J–L.