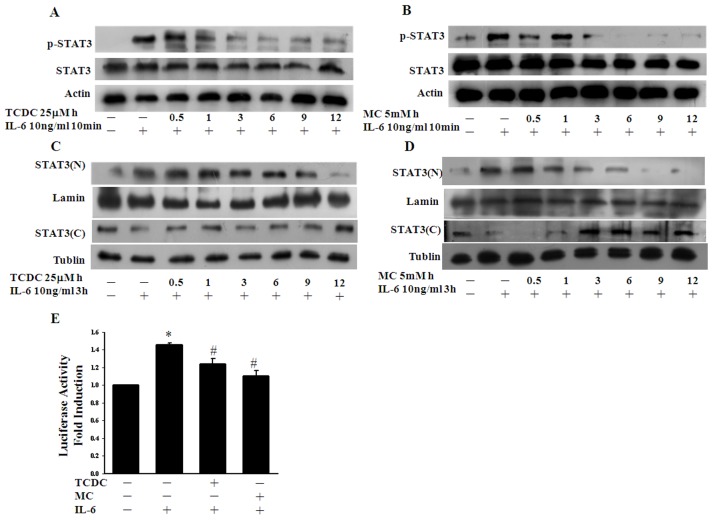
Figure 1. CO inhibition of IL-6-induced STAT3 activation.
A. and B. EC cultures were induced by IL-6 treatment (10ng/ml) for 10 min and a portion of these cells were then pretreated with 25 µM TCDC or 5mM MC for the indicated times. Cell lysates were prepared and subjected to western blot analysis with antibodies against pTyr-STAT3 or STAT3 as indicated. The actin band intensities indicate equal loading of each well. C. and D. ECs were pretreated with TCDC or MC for the indicated times and then stimulated with IL-6. Nuclear (N) and cytosolic (C) extracts were then prepared and subjected to western blot analysis using STAT3 antibodies. The tubulin and lamin band intensities indicate equal loading, respectively. E. ECs were co-transfected with the STAT3 luciferase reporter construct and β-galactosidase for 16 hours. Cells were then exposed to TCDC or MC for 12 hours and to IL-6 for another 6 hours. Luciferase activity was normalized against β-galactosidase activity; the untreated value was taken as 1. *P<0.05 compared with untreated ECs, # P<0.05 compared with IL-6 alone (mean ± SEM).

