
Figure 8.
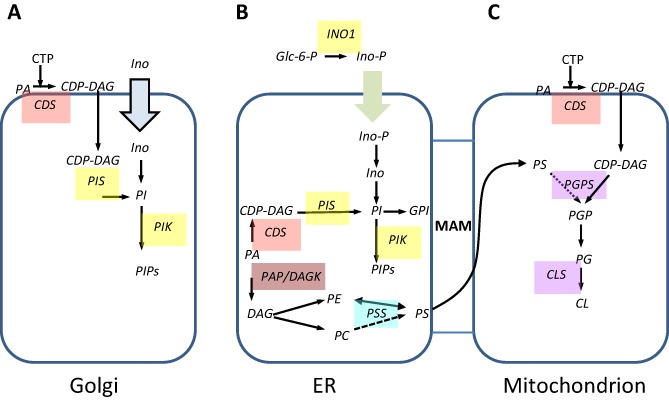
Model of revised pathways for glycerophospholipid synthesis in bloodstream form T. brucei. Enzymes for which candidate genes have been identified are indicated. Block arrows indicate transporters. MAM = mitochondrial associated membranes. Metabolite abbreviations: Glc‐6‐P = glucose 6‐phosphate; PA – phosphatidic acid; CDP‐DAG – cytidine diphosphate diacylglycerol; PGP – phosphatidylglycerophosphate; PG – phosphatidylglycerol, CL – cardiolipin, PS – phosphatidylserine, PE – phosphatidylethanolamine; PI – phosphatidylinositol; PIPs – phosphorylated derivatives of phosphatidyl inositol; DAG – diacylglycerol; PE – phosphatidylethanolamine; IPC – inositol phosphorylceramide. Enzyme abbreviations: CDS – cytidine diphosphate diacylglycerol synthase, PGPS – phosphatidylglycerolphosphate synthase, CLS – cardiolipin synthase, PIS phosphatidlyinositol synthase, PIK – phosphatidylinositol kinase, PSS – phosphatidylserine synthase, PSD – phosphatidylserine decarboxylase, PAP – phosphatidic acid phosphatase, DAGK – DAG kinase. Dotted lines indicate putative pathways.