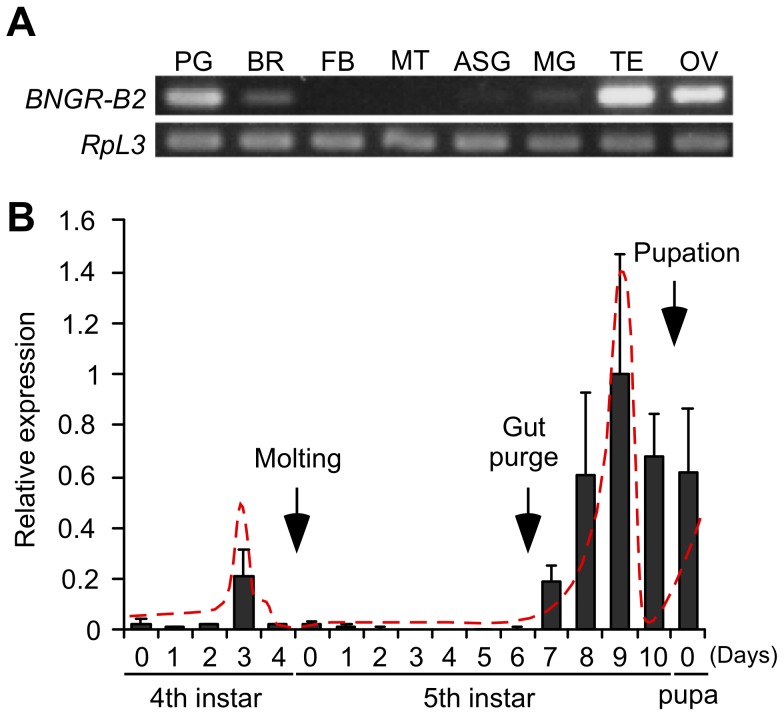
Figure 1. Screening of candidate receptors.
(A) Tissue distribution of BNGR-B2. The expression of BNGR-B2 was measured by RT-PCR in the selected tissues from gut-purged fifth instar larvae (p50T strain). PG: prothoracic gland, BR: brain, FB: fat body, MT: Malpighian tubule, ASG: anterior silk gland, MG: midgut, TE: testis and OV: ovary. (B) Developmental profile of BNGR-B2 in the PGs. The expression of BNGR-B2 was measured by Q-PCR. The timing of molting, gut purge and pupation in our rearing conditions is indicated with arrows. Each datum point represents the mean ±SEM (n = 3). The dashed line indicates the outline of the hemolymph ecdysteroid titer described by Koyama et al., 2004 (4th instar), Sakurai et al., 1998 (5th instar) and Kaneko et al., 2006 (5th instar). (A, B) RpL3 was used as an internal standard.

