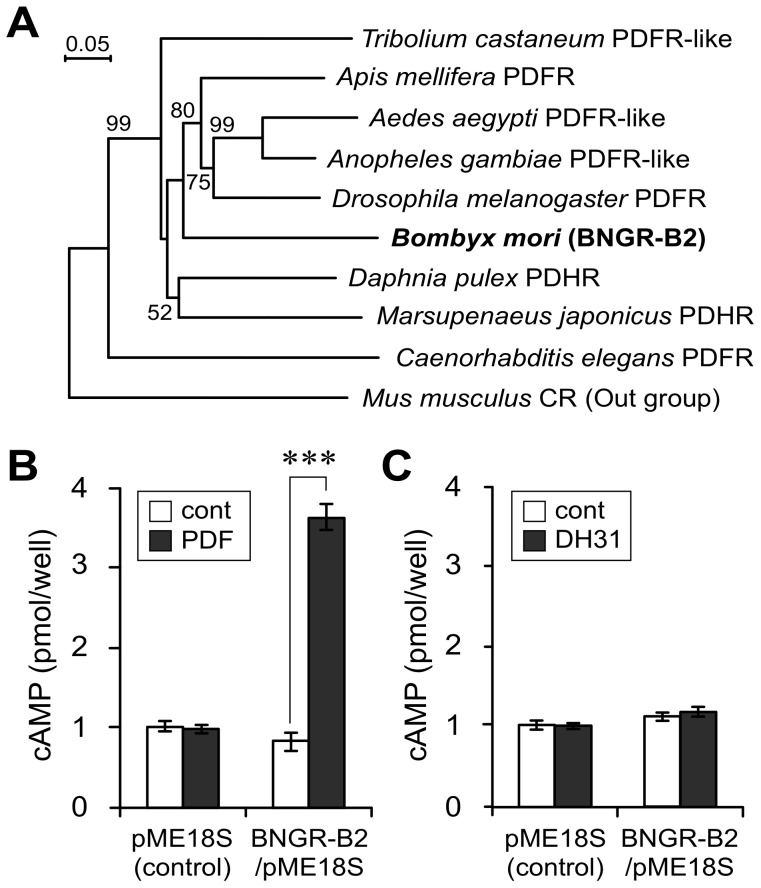
Figure 2. Characterization of BNGR-B2.
(A) Phylogenetic relationship of BNGR-B2 and highly homologous receptors. The tree was generated based on the amino acid sequences of selected regions with the neighbor-joining method using the ClustalX multiple alignment program and a bootstrap value of 1000 trials for each branch position. The indicated numbers are the bootstrap values as a percentage of 1000 replicates, and the scale bar indicates 0.05 changes per residue. Bootstrap values greater than 50% are indicated. The Mus musculus calcitonin receptor (CR) was used as an outgroup. (B) Ligand-binding analysis of BNGR-B2 by examining the change in intracellular cAMP levels. BNGR-B2-expressing HEK293 cells were treated with 1 µM of the candidate BNGR-B2 ligands (PDF and DH31). Each datum point represents the mean ±SEM (n = 5). Statistically significant differences were evaluated by Student's t-test (***P<0.001).

