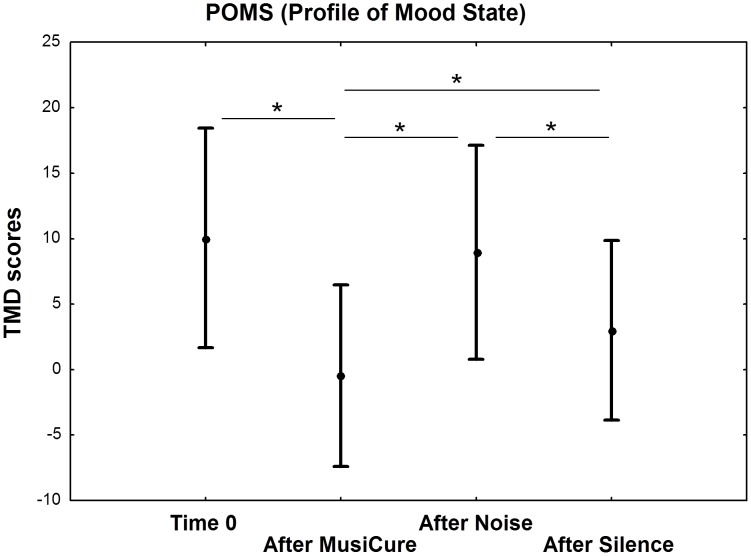
Figure 4. Profile of Mood State (POMS).
Graph (mean ±0.95 confidence interval) showing a main effect of Sound Condition on TMD score of POMS questionnaire. Subjects revealed lower TMD scores after the MusiCure condition compared with all other experimental conditions, and greater TMD scores after the Noise condition compared with those after the Silence condition. Asterisks show statistical significance at p<0.05. See text for statistics.

