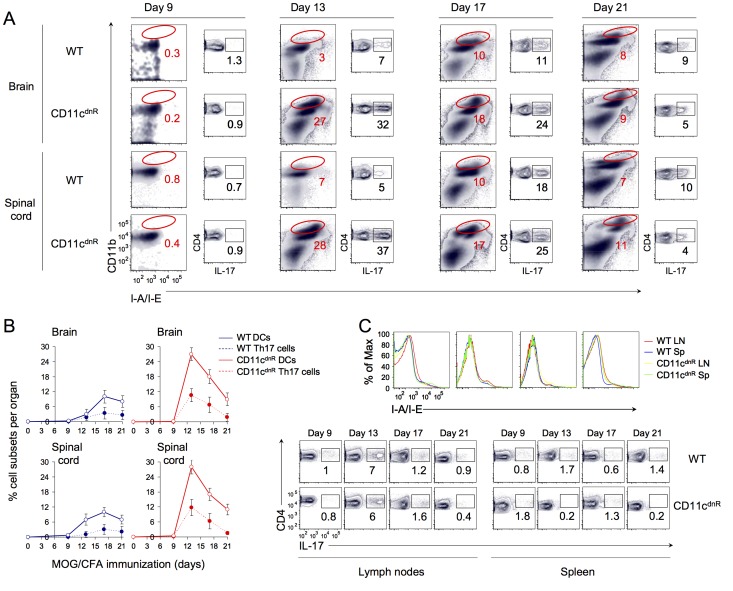
Figure 4. Kinetics of mature DC production lacking TGF-βR signaling correlate with augmented Th17 differentiation in the inflamed CNS.
(A) Flow cytometry of CD11b versus I-A/I-E from total cells and CD4 versus IL-17 from gated CD4+T cells in the brain and spinal cord of CD11cdnR (n = 3) and wild-type (WT) (n = 3) mice at days 9, 13, 17, and 21 post-immunization. Numbers indicate the frequency of CD11bhiMHChi DCs and Th17 cells, respectively. (B) Kinetics of percentages of CD11bhiMHChi DCs (solid line) and Th17 cells (dashed line) in brain and spinal cord from CD11cdnR (red) and wild-type (WT) (blue) mice at days 9, 13, 17, and 21 post-immunization. (C) Histograms display the fluorescence intensity of surface expression of I-A/I-E from B-cell negative gate in lymph nodes (red and yellow) and spleen (blue and green) of CD11cdnR (yellow and green) and wild-type (WT) (red and blue) mice at days 9, 13, 17, and 21 post-immunization. Plots show the distribution CD4 versus IL-17 from gated CD4+ T cells in the lymph nodes and spleen of CD11cdnR and wild-type (WT) mice at days 9, 13, 17, and 21 post-immunization. Data are representative of two independent experiments. Mean ± s.e.m. (B).

