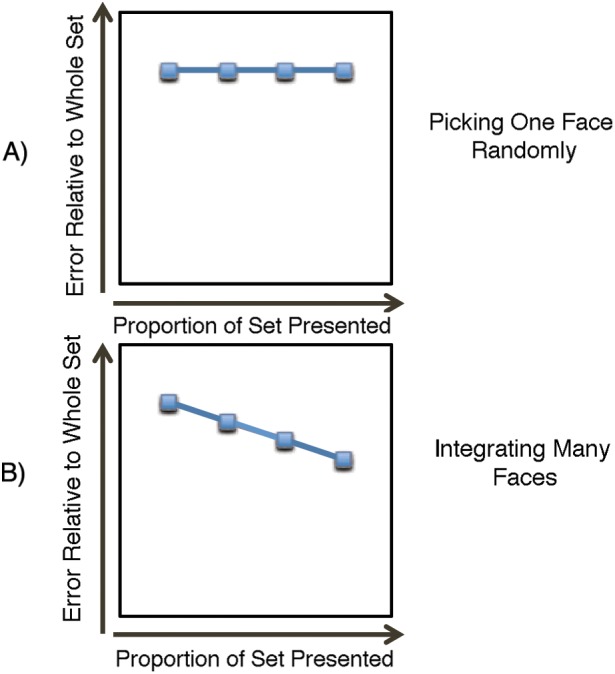
Figure 3.

Participants' predicted error relative to the average of the 18 faces in the set as a function of the proportion of faces that are presented. The x-axis in each graph shows the proportion of faces from the set of 18 that were visible to observers. The y-axis shows the error (inversely proportional to sensitivity). (A) The predicted pattern of errors if the participant bases his or her estimate of the set mean on a single randomly viewed face. In this scenario, if the observer uses one face on which to base a judgment, he/she will not take new information into account. As a result, the participants' error remains constant even when more faces are revealed in the set. (B) The predicted pattern of errors if the participant integrates several faces into his or her estimate of the mean. In this scenario, the participant is incorporating much of the available information into his or her estimate of the mean. As a result, the error systematically decreases as a larger proportion of the set of faces is presented.
