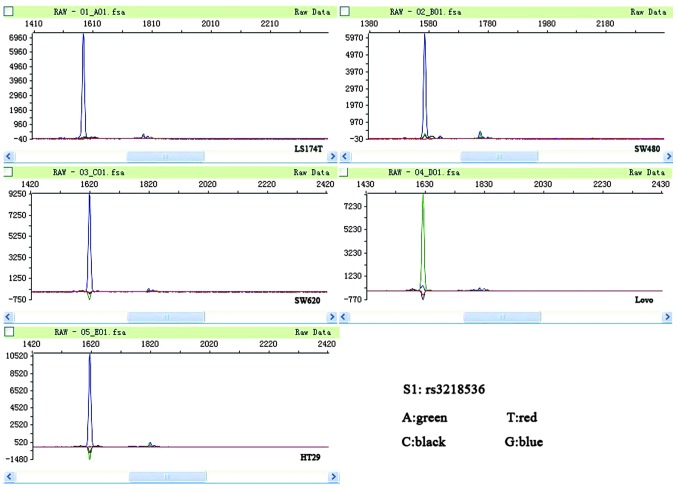
Figure 1.
Peak figure of XRCC2 rs3218536. A green peak, representing A, is apparent in the microsatellite instability (MSI) LoVo cell line, and blue peaks, representing G, are apparent in the other cell lines. A, adenine; T, thymine; C, cytosine; G, guanine; XRCC2, X-ray repair complementing defective repair in Chinese hamster cells 2.

