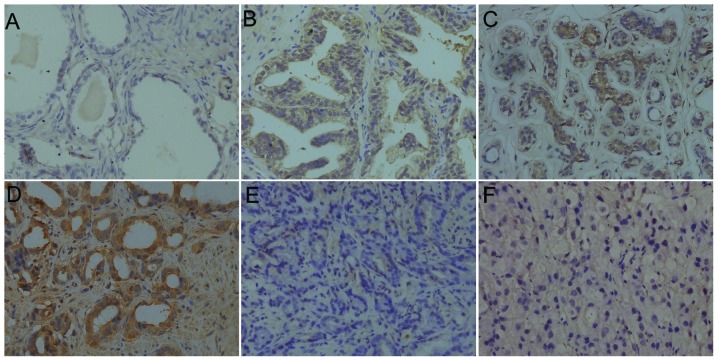
Figure 1.
Pattern of NNMT expression revealed by immunohistochemical staining. (A) Negative NNMT expression was identified in BPH tissues, whereas (B) significant NNMT expression was identified in HGPIN tissues; (C–F) Different expression intensities in (C and D) well-, (E) moderately- and (F) poorly-differentiated PCa tissues (Gleason scores of 5, 6, 7 and 10, respectively). Magnification, ×200.

