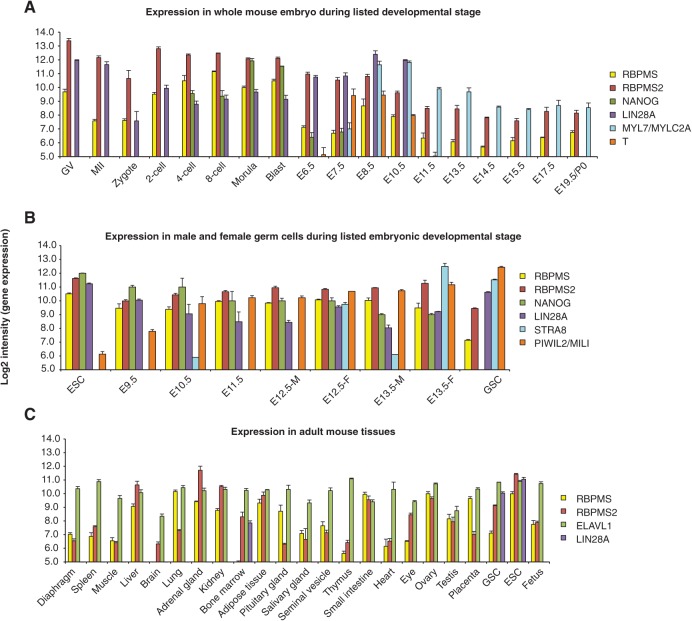
FIGURE 2.
RBPMS and RBPMS2 expression during (A) mouse embryogenesis, (B) germ cell development, and (C) adult tissues. The mean affymetrix microarray expression data are depicted in log2 scale with bars showing SEM. The number of the biological replicates used in these analyses is shown in Supplemental Table 8. Expression of other genes with specific expression patterns during distinct developmental stages is also included. See Materials and Methods for description. (GV) germinal vesicles (immature oocytes); (MII) oocytes at metaphase II stage (mature oocytes); (Blast) blastocyst; (E) embryonic day; (ESC) embryonic stem cells; (M) male; (F) female; (GSC) germline stem cells (in vitro cultured postnatal testicular germline stem cells). Expression of all genes depicted on same plot for ease of representation.

