FIGURE 5.

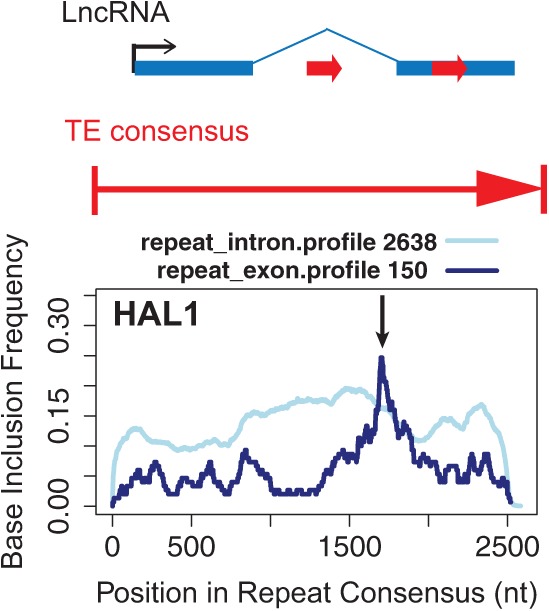
An approach to search for functional TE modules through insertion profiles. Preliminary data are shown for the LINE1-related HAL1 repeat. Top: a hypothetical lncRNA, containing TE fragment insertions in exonic and intronic regions (red arrows). Bottom: The plot shows base-level insertion frequency (y-axis), i.e., the probability of a given nucleotide being found in inserted fragments, with respect to position within the HAL1 consensus sequence (x-axis). Light blue and dark blue lines denote intronic and exonic data, respectively. The number of distinct insertion events upon which the data are based is shown above the plot.
