
FIGURE 1.
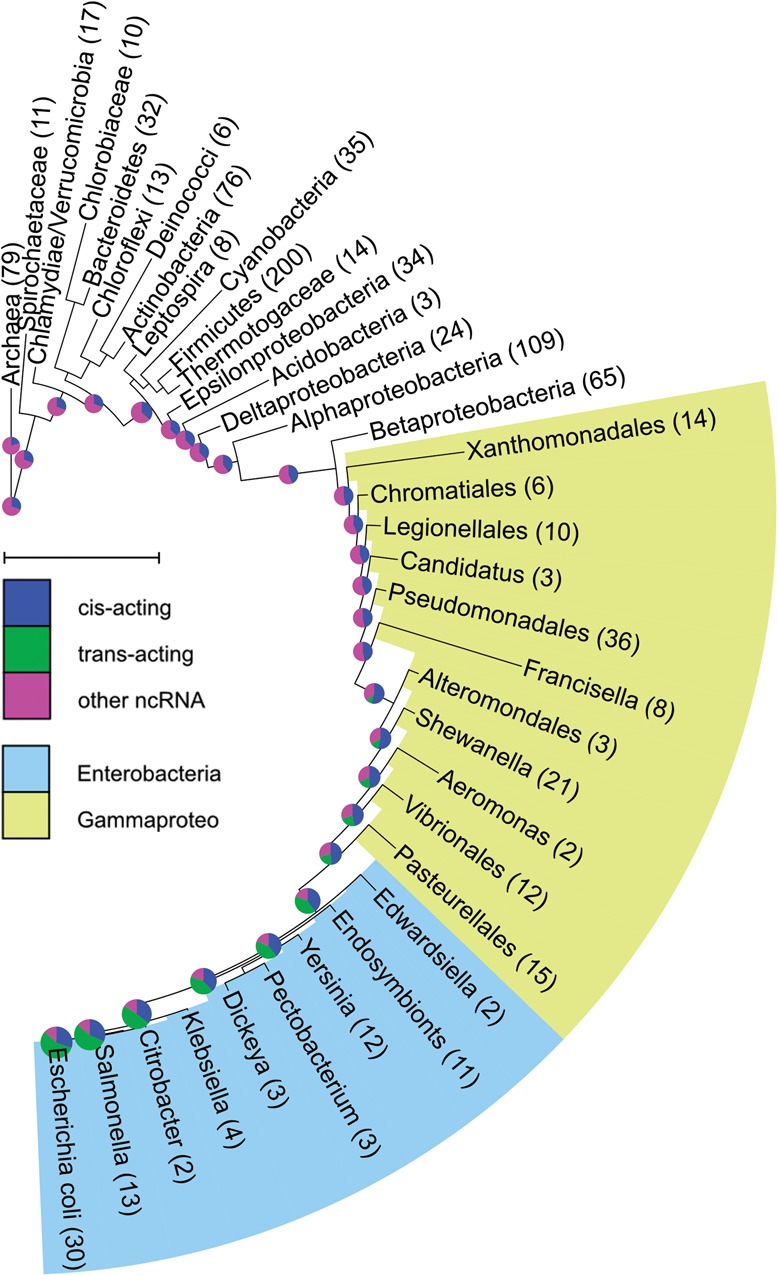
Distribution of E. coli ncRNA families in ancestral genomes. Evolution of ncRNA families, as defined by Rfam, was reconstructed on the phylogenetic tree of prokaryotes. For each ancestral genome of E. coli, the distribution of the three groups of ncRNA families is represented as a pie chart (green indicates trans-acting ncRNAs [sRNAs]; blue, cis-acting ncRNAs; magenta, other ncRNAs). The size of each pie chart is proportional to the number of its total Rfam ncRNA families, ranging from 13 in the oldest ancestor to 102 in E. coli. It can be easily seen that most trans-acting sRNAs of E. coli first appeared inside the γ-proteobacteria class (colored in light green), where most of them appeared when the Enterobacteriales order split from the rest of the γ-proteobacteria and inside the Enterobacteriales (colored in light blue). The numbers in parentheses represent the number of genomes in each clade used for the reconstruction (e.g., the E. coli clade, including also Shigella, contained 30 genomes); scale bar, an evolutionary distance of 0.5-amino-acid substitutions per position. The figure was prepared using iTOL (Letunic and Bork 2007, 2011).