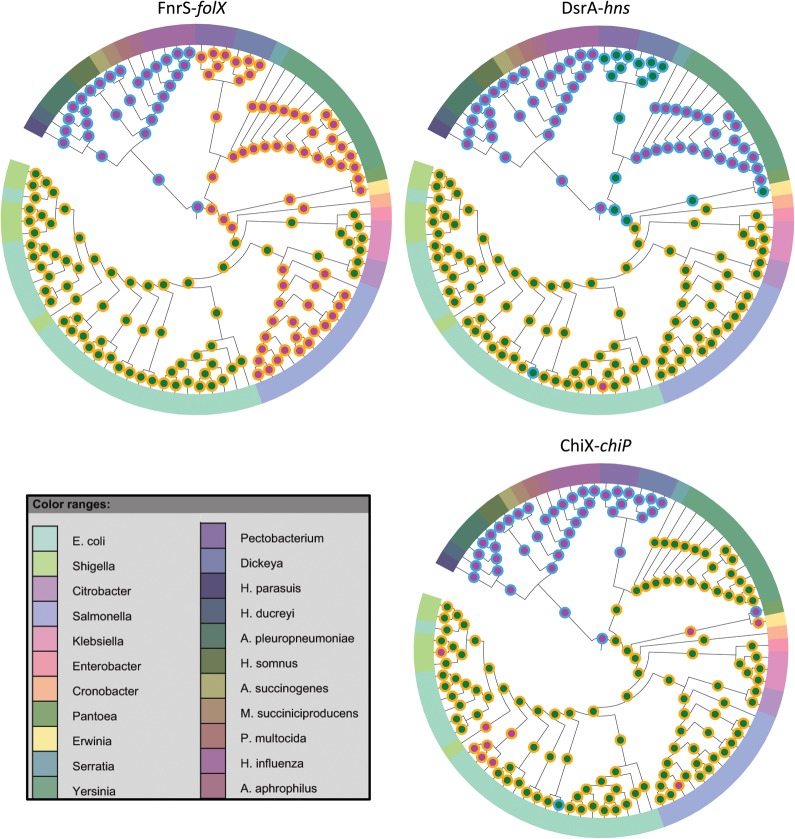
FIGURE 2.
Order of appearance of sRNAs and their binding sites. Three examples of the evolutionary scenarios of the appearance of a sRNA and one of its mBSs are shown. Each tree represents a subset of the γ-proteobacteria class. The outer circle at each node represents the sRNA: It is blue when the sRNA is absent from the genome and orange when it is present. The inner circle represents the mBS: It is magenta for absence and green for presence of the mBS. In the FnrS-folX example, the sRNA appeared before the mBS; in DsrA-hns, the sRNA was gained after the mBS; and in the ChiX-chiP example, the binding site and the sRNA were co-gained along the same branch of the tree. The figures were generated using iTOL (Letunic and Bork 2007, 2011). Branch lengths are not to scale.

