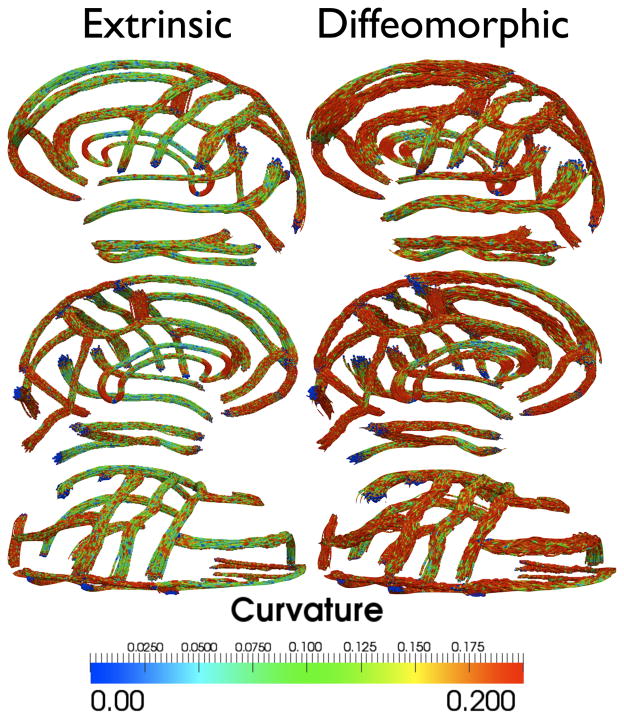
Figure 13.
Comparison of the euclidean and diffeomorphic sulcal atlases for eight different disjoint sub-populations of the original 176 subjects. The sub-populations were obtained after 100 randomized trials of sampling subsets of 22 subjects for each group. For each method, the sulcal atlases are overlaid on top of each other and color-coded by curvature of the curve.

