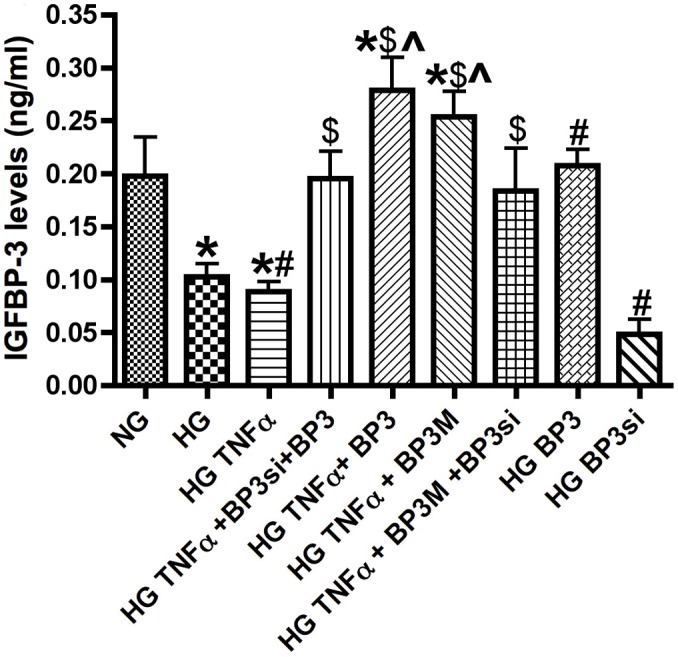
Figure 4. TNFα phosphorylates IGFBP-3 on Serine 111/113.

IGFBP-3 ELISA results for REC treated with normal glucose (NG), high glucose (HG), high glucose + TNFα (HG+TNFα), high glucose + TNFα + IGFBP-3 mutant (mutation on Serine 111/113, (HG+TNFα+BP3Ser-Ala)), and high glucose + TNFα + IGFBP-3 siRNA + IGFBP-3 mutant (HG+TNFα+BP3si+BP3Ser-Ala). *P<0.05 vs. NG, #P<0.05 vs. HG, ∧P<0.05 vs. HG+TNFα $P<0.05 vs. HG+TNFα+BP3Ser-Ala. All data are mean ± SEM. Data is from 3–4 independent experiments for each treatment.
