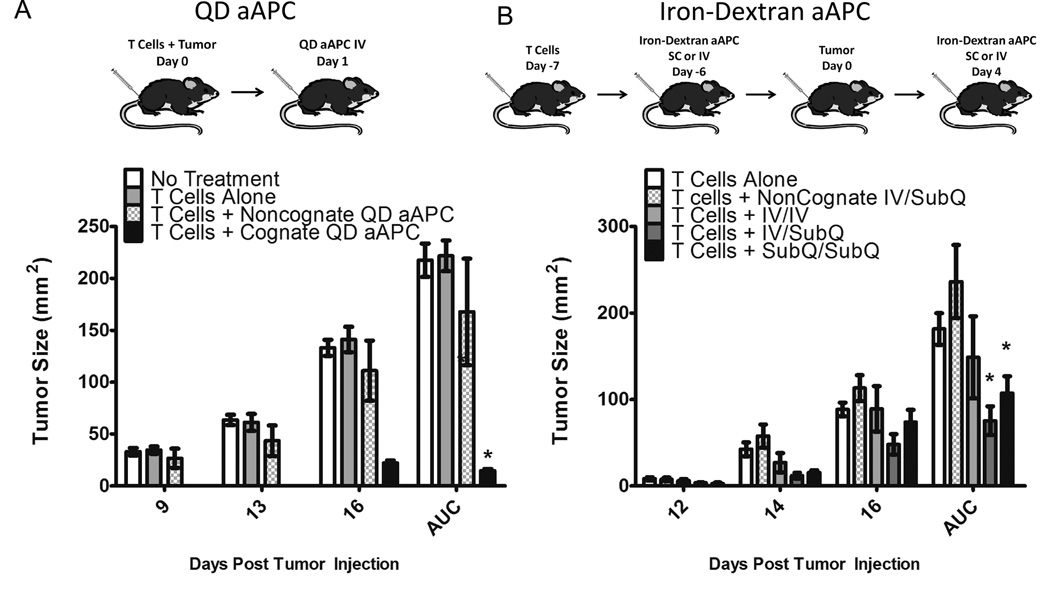
Figure 6.
Nano-aAPC Inhibit Tumor Growth In Vivo
(A) QD aAPC. B16 Tumors were injected subcutaneously on day 0, with injection of naive pMEL T cells on the same day. One day later, QD aAPC were injected intravenously (iv). IL-2 was administered on days 3, 4, and 5. Tumor size was measured as surface area (mm2) on indicated days, with area under the curve (AUC) shown at right. Mice treated with pMEL T cells and cognate QD aAPC (black bars) had less tumor growth compared to no treatment (white), T cells alone (light grey), and T cells + noncognate QD aAPC (checkered) (4 mice per group). Significance was characterized over entire experiment by AUC (p<0.001 by ANOVA with Tukey’s Post-Test, * indicates significant difference from no treatment group).
(B) Iron-Dextran aAPC. Naive pMEL T cells were injected intravenously on day -7. One day later, iron-dextran aAPC were injected either iv or subcutaneously (sc) on the right flank. B16 tumors were injected sc on right flank on day 0. Mice in treatment arms were given an additional injection on day 4 post tumor injection either iv or sc, to form four treatment groups: noncognate aAPC iv (day -6) then sc (day 4) (checkered), cognate aAPC iv then iv (light grey), cognate aAPC iv then sc (dark grey), and cognate aAPC sc then sc (black). Mice treated with pMEL T cells and cognate Iron-Dextran aAPC iv/sc or sc/sc (filled squares) had less tumor growth compared to noncognate aAPC (7 mice per group, p<0.02 by ANOVA with Tukey’s Post-Test, * indicates significant difference from no treatment group).

