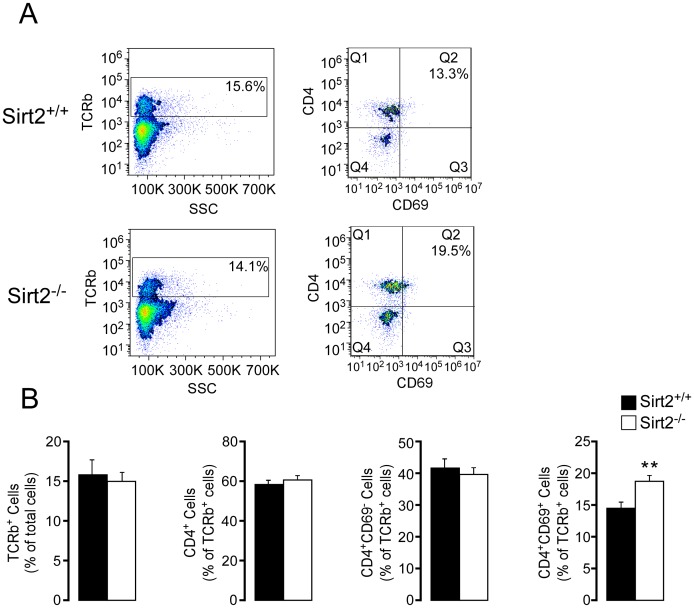
Figure 4. CD4+CD69+ T cells are increased in mesenteric lymph nodes from Sirt2−/− mice with DSS-induced colitis.
(A) Representative images of FACS analysis demonstrating TCRb+ cells (left), and their composition sorted by CD4 and CD69 staining (right). (B) The composition of MLNs is compared between Sirt2+/+ and Sirt2−/− mice; TCRb+, CD4+, CD4+CD69−, and CD4+CD69+ cells. n = 10/group. Results are expressed as the mean ± SEM. *P<0.05; **P<0.01; ***P<0.001.

