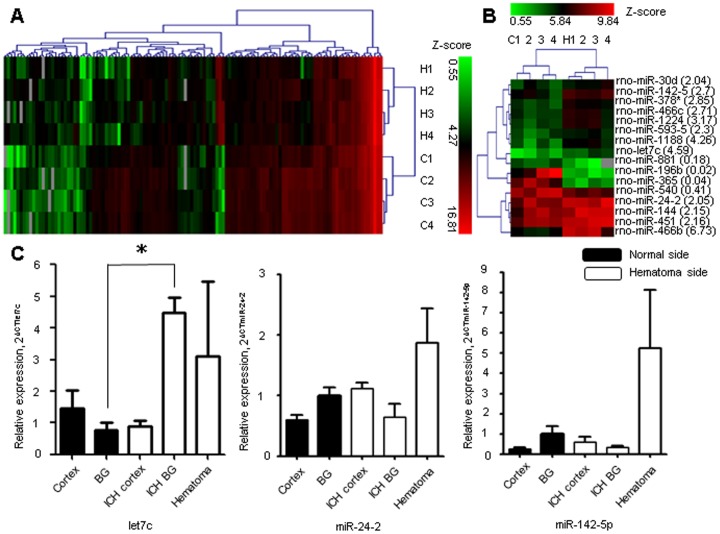
Figure 1: The microRNA expression after intracerebral hemorrhage.
The heat map shows the microRNA (miRNA) expression pattern from the microarray between the left hemorrhagic hemisphere and right non-hemorrhagic hemisphere, with statistically significant difference (p<0.05) by paired t-test (A), and the difference of more than two folds by paired t-test (p<0.05) (B). The level of let7c was increased in the basal ganglia in the region specific manner by quantitative real time polymerase chain reaction study (C). *P<0.05, n = 4–5 per group, H, hemorrhagic hemisphere, C, contralateral hemisphere, BG, basal ganglia, ICH, intracerebral hemorrhage.

