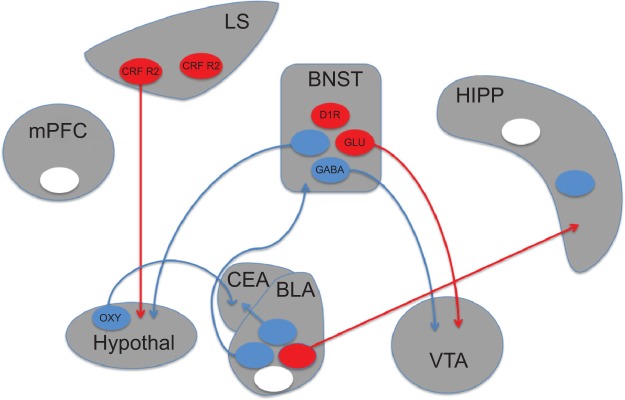
Figure 1.

Schematic depiction of brain circuits controlling anxiety.
Notes: Recent studies utilizing optogenetic approaches have implicated discrete populations of neurons and neural projections in anxiety disorders. Circles represent populations of neurons that have been targeted with optogenetic manipulations. Anxiogenic populations are represented in red, anxiolytic in blue, and populations producing no effect in white. Experiments in which opsins were targeted to genetically-defined cell populations are indicated by the relevant cell type listed within the circle. The presence or absence of projections from these neurons (circles) in the figure indicates whether the represented experiment targeted optical manipulations at terminals or cell bodies, respectively.
Abbreviations: BLA, basolateral amygdala; BNST, bed nucleus of the stria terminalis; CEA, central nucleus of the amygdala; CRF R2, corticotropin-releasing factor receptor 2; D1R, dopamine receptor D1; GABA, gamma-aminobutyric acid; Glu, glutamate; HIPP, hippocampus; hypothal, hypothalamus; LS, lateral septum; mPFC, medial prefrontal cortex; oxy, oxytocin; VTA, ventral tegmental area.
