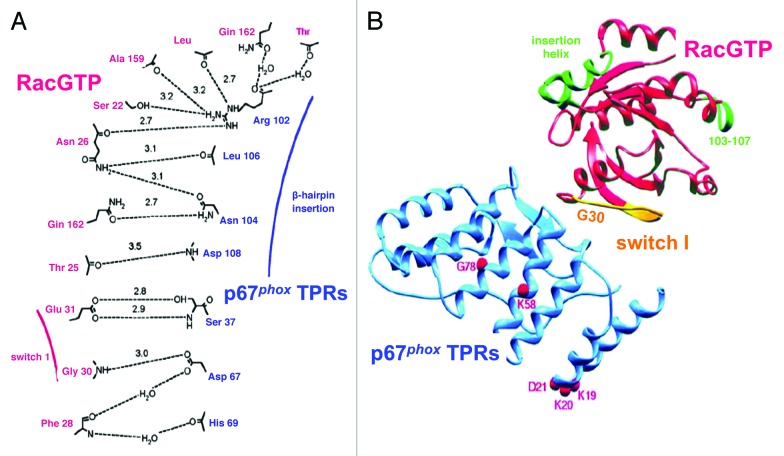
Figure 1. The interface between Rac and p67TPR. (A) Schematic representation of the hydrogen bond interactions at the interface between Rac and p67phox TPRs. Residues from Rac are labeled in red and residues from p67phox TPRs, in blue. Hydrogen bonds are depicted as dotted lines with the bond distances indicated in Å. The positions of switch I and the β hairpin insertion are indicated in red and blue, respectively. (B) Ribbons representation of the RacGTP (red)/p67phox TPR (blue) complex. The effector loop of Rac is colored in yellow, and amino acids 103–107 and the helical insert region (120–135) are indicated in green. The position of Gly30 at the N terminus of the effector loop is indicated to show the orientation of switch I. The positions of mutations in p67phox occurring in CGD are shown as red spheres (Reprinted with permission from ref. 73. Copyright 2000, Elsevier).

An official website of the United States government
Here's how you know
Official websites use .gov
A
.gov website belongs to an official
government organization in the United States.
Secure .gov websites use HTTPS
A lock (
) or https:// means you've safely
connected to the .gov website. Share sensitive
information only on official, secure websites.
