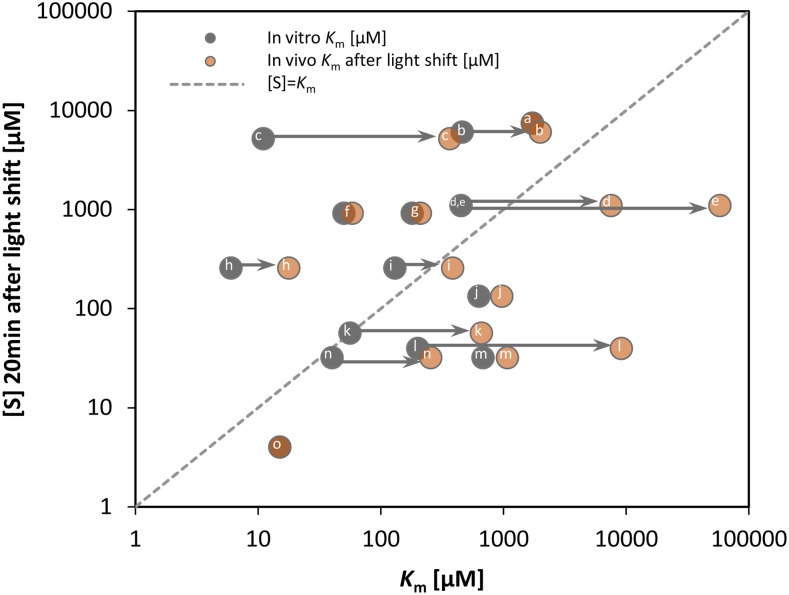
Figure 12.
In Vitro and in Vivo Km Values versus Substrate Concentrations [S].
The substrate levels 20 min after the light shift of CBC reactions (Figure 11) are plotted against in vitro Km (dark gray) (literature values; for details, see Supplemental Table 3) and in vivo Km (light gray) calculated based on substrate saturation curves (Figure 11). Arrows indicate >2-fold increases between in vitro and in vivo Km values. Enzymes with their substrate in parentheses: aPGK (3PGA), bTRK (S7P), cRubisco (RuBP), dFBA (DHAP), eSBA (DHAP), foxidized SBPase (SBP), greduced SBPase (SBP), hoxidized FBPase (FBP), ireduced FBPase (FBP), jRPI (R5P), kPRK (Ru5P), lSBA (E4P), mTPI (GAP), nFBA (GAP), and oGAPDH (BPGA). In Supplemental Figure 18, the corresponding plot with substrate levels at the low light intensity is shown.
[See online article for color version of this figure.]

