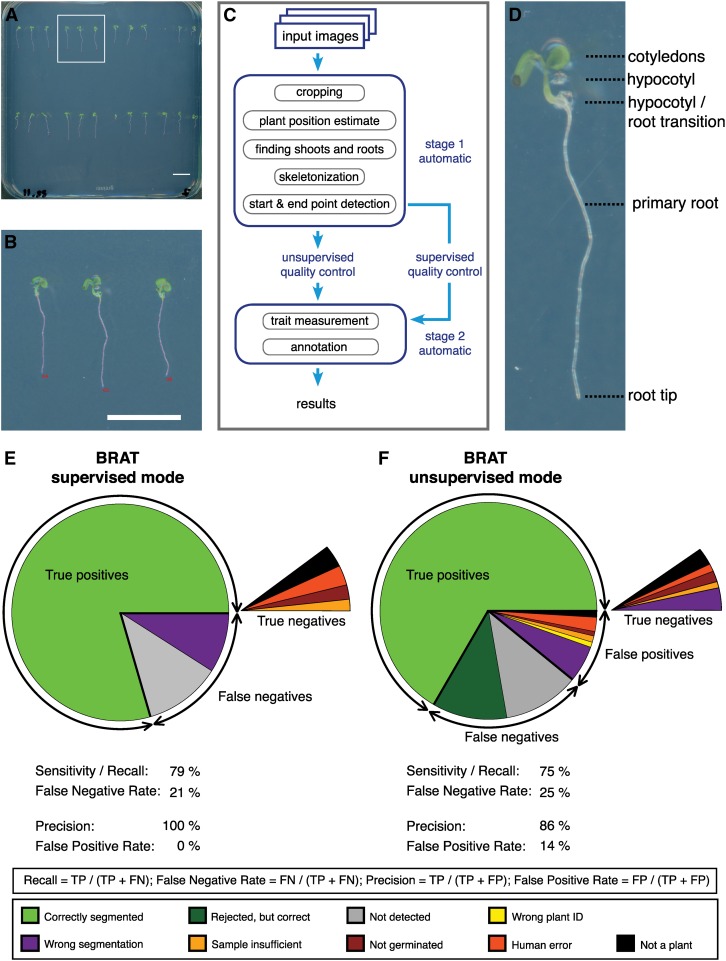
Figure 2.
Overview of BRAT Pipeline.
(A) Whole plate image. Highlighted area corresponds to magnification shown in (B). Bar = 1 cm.
(B) Segmented roots superimposed on the original image. Bar = 1 cm.
(C) Flowchart of BRAT workflow.
(D) Anatomy of a 3-d-old Arabidopsis seedling.
(E) BRAT performance in supervised mode.
(F) BRAT performance in unsupervised mode.
FN, false negatives; TP, true positives; FP, false positives; N, total number of objects.

