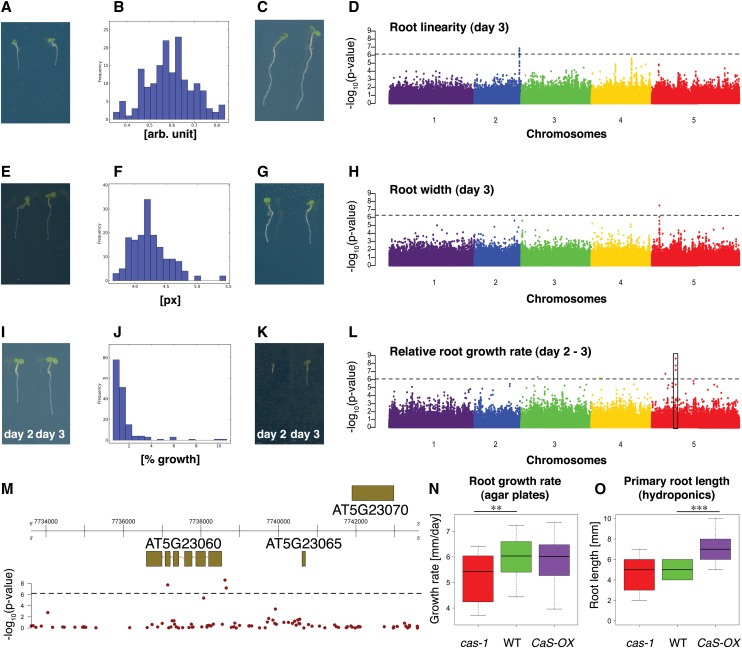
Figure 4.
Genome-Wide Association Mapping for Root Traits.
(A) to (D) Root linearity trait on day 3.
(E) to (H) Root width at 20 to 40% interval of root on day 3.
(I) to (M) Relative root growth rate trait (day 2 to day 3). Box indicates region depicted in (M).
(A), (E), and (I) Examples for accessions with low trait values.
(C), (G), and (K) Examples for accessions with high trait values.
(B), (F), and (J) Histogram of mean trait values for accessions.
(D), (H), and (L) Manhattan plots for GWAS. Line denotes 5% FDR threshold. Black box in (L) indicates location of most significant association of all GWAS performed in this study.
(M) Genomic region surrounding the most significant GWA peak from (L). Top: gene models in genomic region. The x axis represents the position on chromosome 5. Bottom: −log10(P values) of association of the SNPs. Line denotes 5% FDR threshold.
(N) and (O) Effects of loss of function and overexpression of CaS gene on root growth rate on day 7 to 8 (n > 26) on MS agar plates (pH 5.7) (N) and root length in hydroponic culture on day 5 (n = 17) in 2% MGRL nutrient solution (pH 5.0) (O). x axis, genotype; y axis, root growth rate (mm/day) or primary root length (mm), respectively; whiskers, ± 1.5 times the interquartile range; Student’s t test P value < 5*10−3 and < 5*10−4 indicated by two asterisks and three asterisks, respectively.

