Figure 3.
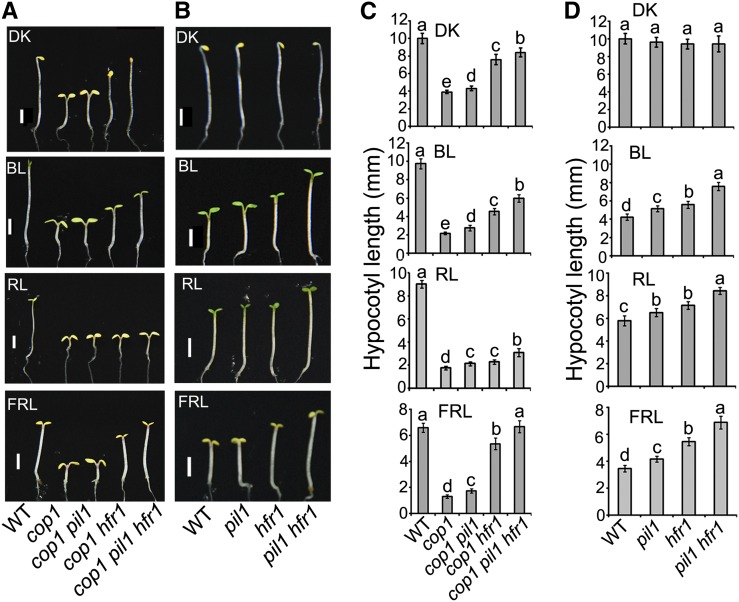
PIL1 and HFR1 Act Genetically Downstream of COP1.
(A) and (B) Photographs of representative seedlings of the indicated genotypes. Seedlings grown under continuous light conditions for 4 d. Bars = 2 mm.
(A) DK, darkness; BL, blue light (0.3 μmol/s·m2); RL, red light (0.3 μmol/s·m2); FRL, far-red light (0.5 μmol/s·m2).
(B) DK, darkness; BL, blue light (15 μmol/s·m2); RL, red light (8 μmol/s·m2); FRL, far-red light (2 μmol/s·m2).
(C) and (D) Quantification of hypocotyl lengths of the seedlings shown in (A) and (B). Error bars represent ±sd (n = 30). The letters “a” to “e” indicate statistically significant differences between means for hypocotyl lengths of the indicated genotypes, as determined by Tukey’s LSD test (P ≤ 0.01).

