Figure 3.
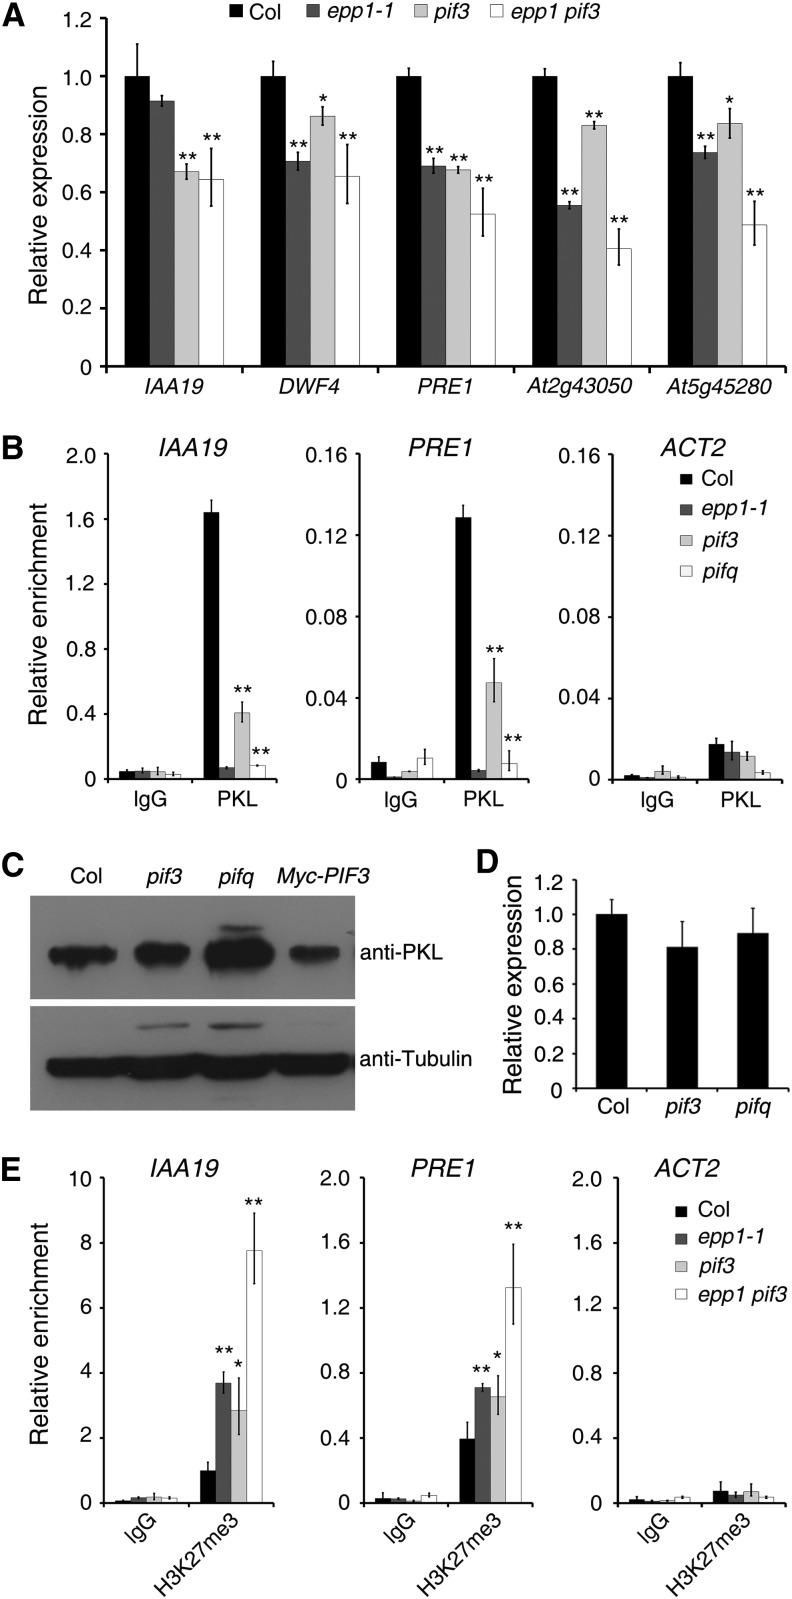
The Binding of PKL to Targets Is Largely Dependent on PIF3.
(A) Relative expression of cell elongation–related genes in Col wild-type, epp1, pif3, and epp1 pif3 mutant plants. The amounts of mRNA were quantified by RT-qPCR, and the relative expression levels were normalized to that of a UBQ control.
(B) ChIP-qPCR assay. Data show the relative enrichment of IAA19, PRE1, and ACT2 (negative control) promoter fragments upon precipitation with anti-PKL antibody or the IgG control.
(C) Immunoblot assay showing PKL protein levels in the pif3 and pifq mutants and PIF3 overexpression plants. Immunoblotting using an anti-tubulin antibody served as the loading control.
(D) Relative PKL expression in the pif3 and pifq mutants. The amounts of mRNA were quantified by RT-qPCR, and the relative expression levels were normalized to that of a UBQ control.
(E) ChIP-qPCR assay showing the relative enrichment of IAA19, PRE1, and ACT2 (negative control) promoter fragments upon precipitation with H3K27me3 antibody.
For all experiments, the wild-type and various mutant seedlings were grown in darkness for 5 d. In (A), (B), (D), and (E), data represent means ± sd of biological triplicates. Asterisks indicate significant differences from the wild type at P < 0.05 (*) or P < 0.01 (**) using Student’s t test.

