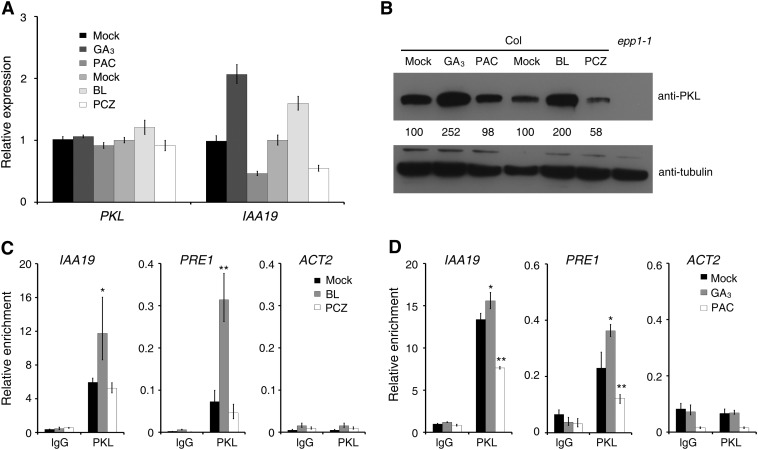
Figure 6.
PKL Protein Accumulation and Binding Ability Are Regulated by BR and GA.
(A) Relative expression levels of PKL and IAA19, as determined by quantitative RT-PCR. Data represent means ± sd of biological triplicates.
(B) Immunoblot analysis showing PKL protein levels in Col seedlings treated with BR and GA and their inhibitors. Immunoblotting against tubulin antibody served as a loading control. Values denote relative amounts of PKL normalized to the tubulin control, and values in the mock controls are set as 100.
(C) and (D) ChIP-qPCR assay showing the relative enrichment of IAA19, PRE1, and ACT2 genomic fragments by PKL when the Col seedlings were treated with BR (C) or GA (D). Data represent means ± sd of biological triplicates. For the BR treatment, Col wild-type seeds were germinated on MS medium for 1 d and were then transferred to MS plates without (mock) or with BL (0.2 μM) or PCZ (1 μM) and grown for an additional 4 d. For the GA treatment, 3-d-old Col seedlings were transferred to medium without (mock) or with GA3 (10 μM) or PAC (0.1 μM) and grown for an additional 2 d. All treatments were performed in darkness. Asterisks indicate significant differences from the mock treatment at P < 0.05 (*) or P < 0.01 (**) using Student’s t test.

