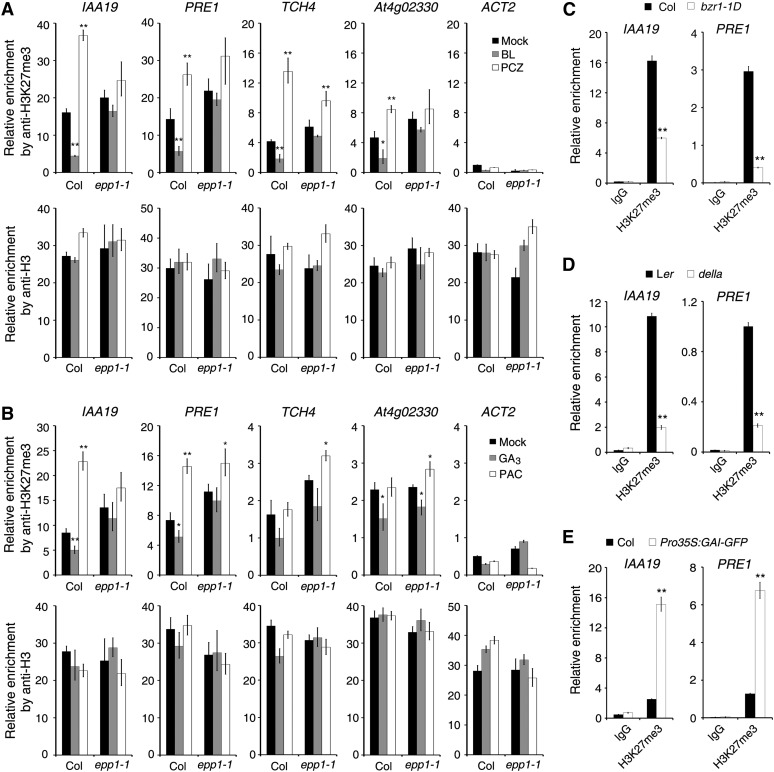
Figure 7.
BR and GA Signaling Regulate H3K27me3 Modification.
(A) and (B) ChIP-qPCR assays showing the relative enrichment of genomic fragments pulled down by the H3K27me3 and H3 (control) antibodies when seedlings were treated with BL and the inhibitor PCZ (A) or with GA3 and the GA inhibitor PAC (B). Data represent means ± sd of biological triplicates. Seedlings were treated as described in the legend to Figure 6.
(C) ChIP-qPCR assay. Col and bzr1-1D seedlings were grown in medium containing 1 μM PCZ in darkness for 5 d.
(D) ChIP-qPCR assay. Landsberg erecta (Ler) wild-type and della mutant seedlings were grown in medium containing 0.1 μM PAC in darkness for 5 d.
(E) ChIP-qPCR assay. Col wild-type and Pro35S:GAI-GFP transgenic seedlings were grown in darkness for 5d.
For (C) to (E), the protein-DNA complexes were pulled down by the H3K27me3 antibodies or IgG control, and the DNA fragments were quantified by qPCR. For all panels, data represent means ± sd of biological triplicates. Asterisks indicate significant differences from the wild type or mock treatment at P < 0.05 (*) or P < 0.01 (**) using Student’s t test.

