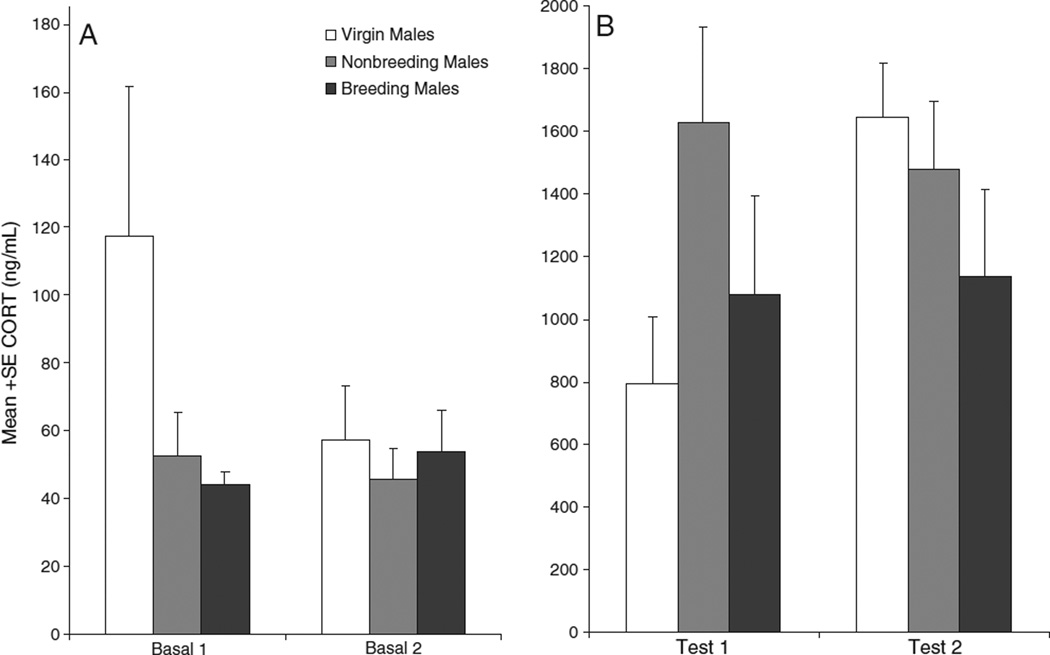
Fig. 2.
Plasma corticosterone concentrations of breeding, nonbreeding and virgin male California mice in phase 1 and phase 2. A: Baseline CORT concentrations; B: CORT concentrations immediately following exposure to predator urine. CORT levels were significantly higher after predator-urine exposure than under baseline conditions (P<0.001). A group×phase×basal_test interaction (P=0.031) revealed that the change in CORT responses to stress from test 1 to test 2 differed among groups. Virgin males tended to increase their CORT response to stress from phase 1 to phase 2 (P=0.075), whereas breeding and nonbreeding males did not. Note difference between graphs in y-axis scale.

