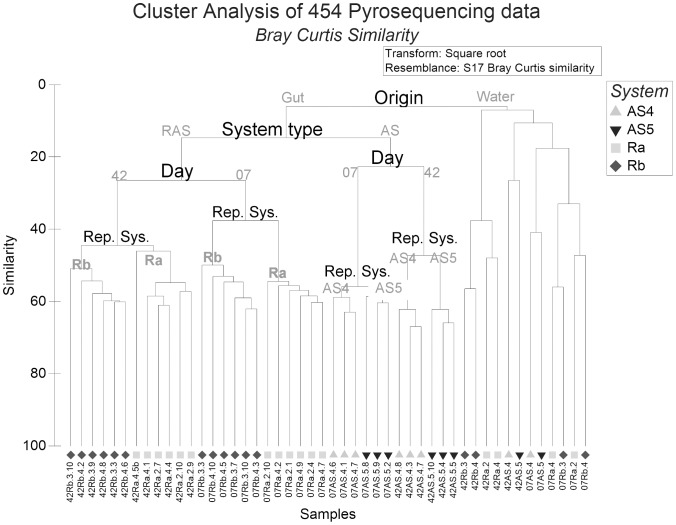
Figure 1. Hierarchical clustering with Unweighted Pair Group with Arithmetic Mean (UPGMA) linkage of gut and water samples based on 454 data.
On y-axis: similarity percentage based on Bray Curtis similarity, on x-axis: all individual samples of gut (left) and water (right). D07 and 42: sampling day 7 & 42, AS 4 & 5: replicate active suspension systems 4 & 5, Ra and Rb: replicate recirculating system a and b. Numbers 2, 4 & 3, 4: replicate tanks from Ra and Rb respectively. Last digits following the tank number indicate the number of replicate fish in each tank. Since only one water sample was taken from each tank, the last digits were omitted from water sample’s ID. (e.g. 42Rb.3.10: Gut of day 42, from recirculating system b, tank 3, fish 10 whereas 07Ra.2: Water of day 7, from recirculating system a, tank 2).

