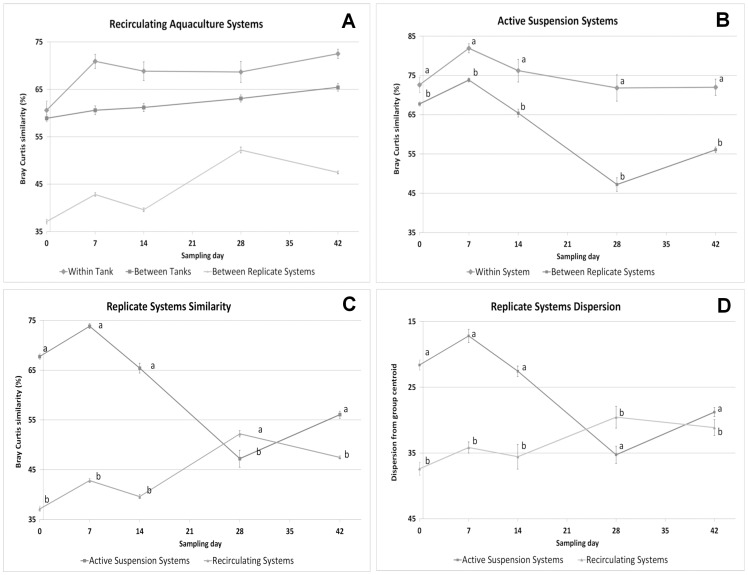
Figure 4. Bray Curtis similarity (%) (A, B & C) and dispersion from centroid based on Euclidian distance (D) for each sampling day.
Points represent mean values of gut microbiota between individuals reared either in the same tank (Within tank), replicate tanks (Between tank) or between systems (Between System). (A): Comparison for Recirculating Aquaculture Systems (RAS). (B) Comparison for Active Suspension (AS). (C) Comparison between RAS and AS Systems & (D) Dispersion of samples from group centroid in RAS and AS systems. Error bars show standard error. Different data labels (a, b and c) per sampling day indicated significant difference (P<0.05) based on one-way ANOVA and Bonferroni ranking test for A, B & C and permutation dispersion test for D, (P(perm)<0.05).

