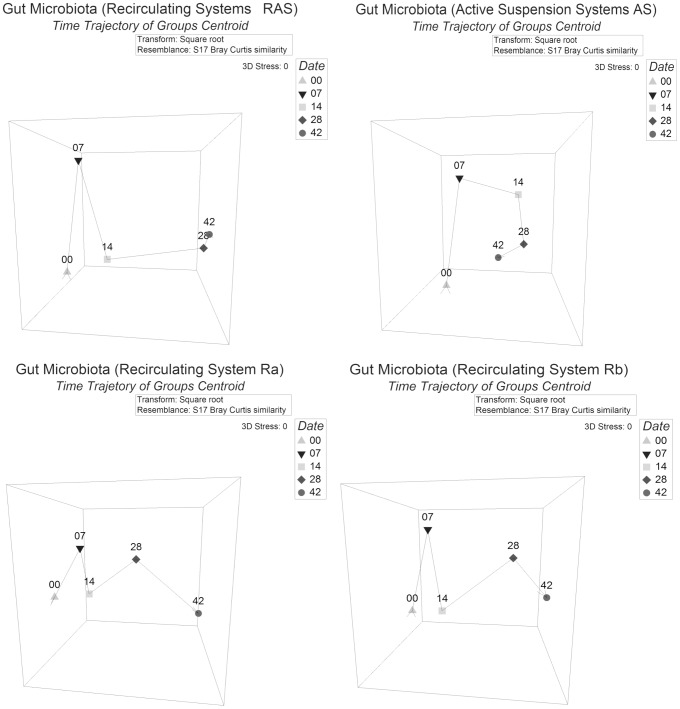
Figure 5. Three dimensional nMDS plots of gut microbiota from different systems over time (trajectory).
Plots are based on Bray Curtis distance after square root transformation of relative abundance DGGE data. D00, 07, 14, 28, 42: sampling days 0, 7, 14, 28 & 42 respectively. Each point in the plots represents the group centroid and the shift of group average microbiota in time. Zero stress values for each plot are indicative of the fit due to the representation of the centroids. AS and RAS: active suspension and recirculating system, Ra & Rb: replicate recirculating system a & b.

