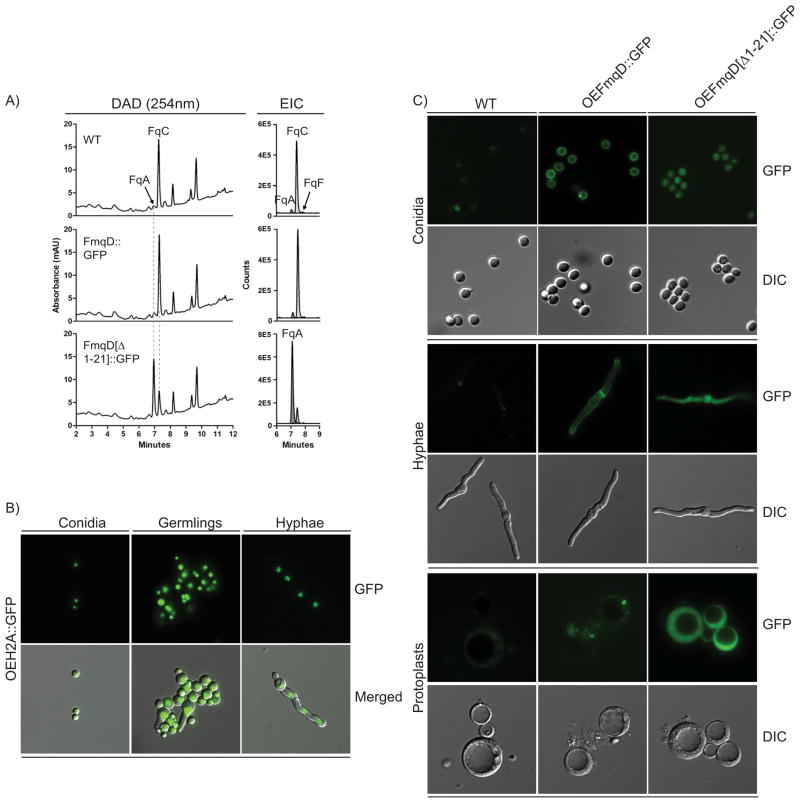
Figure 5.
Characterization of N-terminal signal peptide involvement in FqC biosynthesis. A) Fq profiles of FmqD::GFP and FmqD[Δ1-21]::GFP on solid growth cultures. Left panel: Diode array detector (DAD) trace from 254nm detection. Right panel: Overlay of extracted ion chromatogram (EIC) for the Fq metabolites FqA (RT = 7.1 min), FqC (RT = 7.4 min), and FqF (RT = 7.9 min). The Fqs were identified with the Agilent MassHunter software using the “Find Compound by Formula” option. B) Overexpression of histone H2A still maintained nuclear localization in various developmental tissues examined in this study. From left to right: conidia, germlings, and hyphae. Top Row: GFP. Bottom Row: Merged GFP and differential interference contrast (DIC) C) FmqD is cell wall-associated. Top Panel: Conidia. Middle Panel: Hyphae. Bottom Panel: Protoplasts. Protoplasts from the OEFmqD::GFP strain lose cell wall fluorescence while those from the OEFmqD[Δ1-21]::GFP strain retained cytoplasmic fluorescence. Top Row: GFP. Bottom Row: differential interference contrast (DIC)

