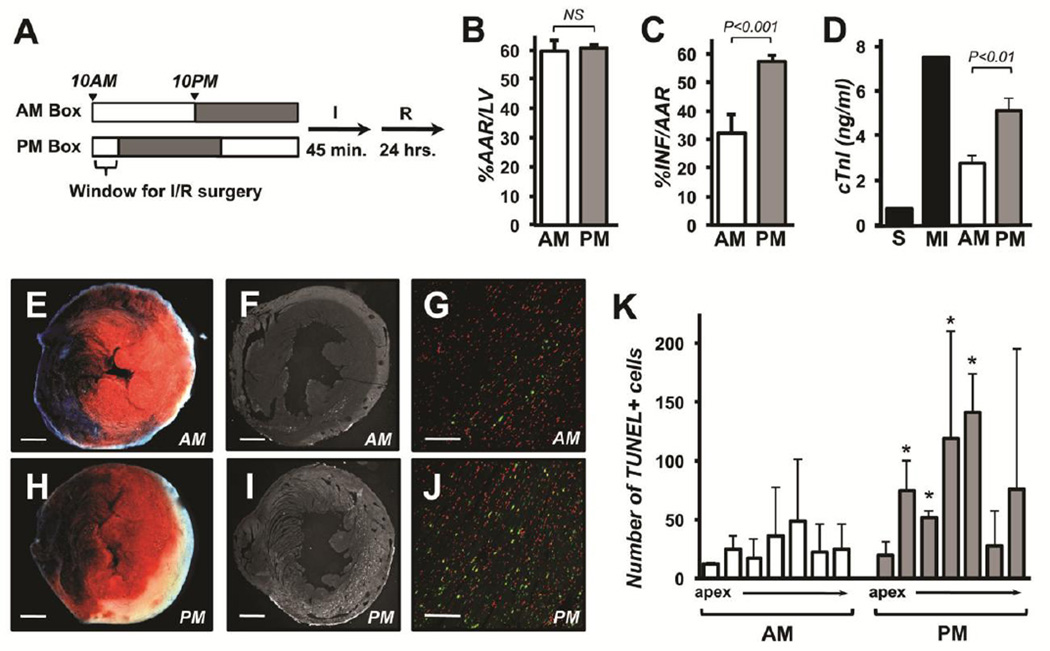
Figure 1.
Damage from I/R is greater at the end of the light phase (PM) than at the beginning of the light phase (AM) in wild type mice. The schematic illustrates the timing of light entrainment and I/R surgeries for the AM and PM boxes (A). Grey shadowing indicates periods of “lights-off”. Area at risk (%AAR/LV) (B), infarct (%INF/AAR) (C), and circulating cardiac troponin I levels (D) in the AM (n=7) or PM (n=10) operated animals 24 hours after I/R. Troponin levels in sham operated animals (S) and animals with permanent LAD (MI) are provided for comparison. Representative images of TTC and Evans blue staining (E and H) and TUNEL-positive signal (F, G, I and H) are provided for AM (E, F, and G) PM (H, I, and J) surgeries. Green indicates TUNEL-positive nuclei and red total nuclei in the image overlays in G and J. The inset bar indicates either 1 mm (in E, F, H, and I) or 0.1 mm (G and H). Quantification of TUNEL-positive signals in individual 1mm slices arrayed from apex to the site of ligation from AM and PM hearts 24 hours after I/R. (n=3 per slice). Error bars indicate standard error.

